# PBX Call Activity Report
The PBX Call Activity report breaks down internal and external call activity by hour, day, and month, giving you a clear view of how traffic moves through your trunks and extensions. (PBX stands for Private Branch Exchange, the phone system that routes your organization's calls.) This page shows how to open the report, tune what it displays, and what each metric means.
## Open the PBX Call Activity report
1. Sign in to the PBX web portal and go to **Reports and Recordings > Call Reports**.
2. Open the report:
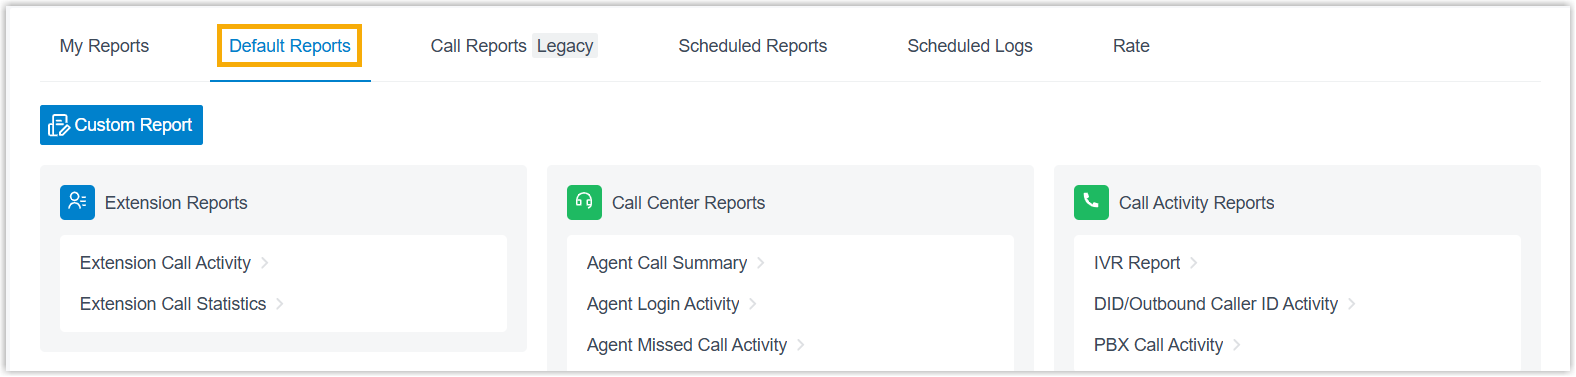
1. Select the **Default Reports** tab.
:::note
Cloud Voice rebuilt its CDR (Call Detail Record, the log kept for every call) module in version **84.21.0.117**, introducing a new data structure that displays call details more clearly and completely. After the upgrade, older CDRs and their associated report data are removed gradually according to your **CDR Auto Cleanup** setting. Until that cleanup finishes, new and historical data are kept apart: the **Default Reports** tab holds the new data, and the **Call Reports (Legacy)** tab holds the historical data.
The steps below cover the new report data generated on version 84.21.0.117 or later. To work with historical data instead, open the **Call Reports (Legacy)** tab.
:::
2. In the **Call Activity Reports** pane, click **PBX Call Activity**.
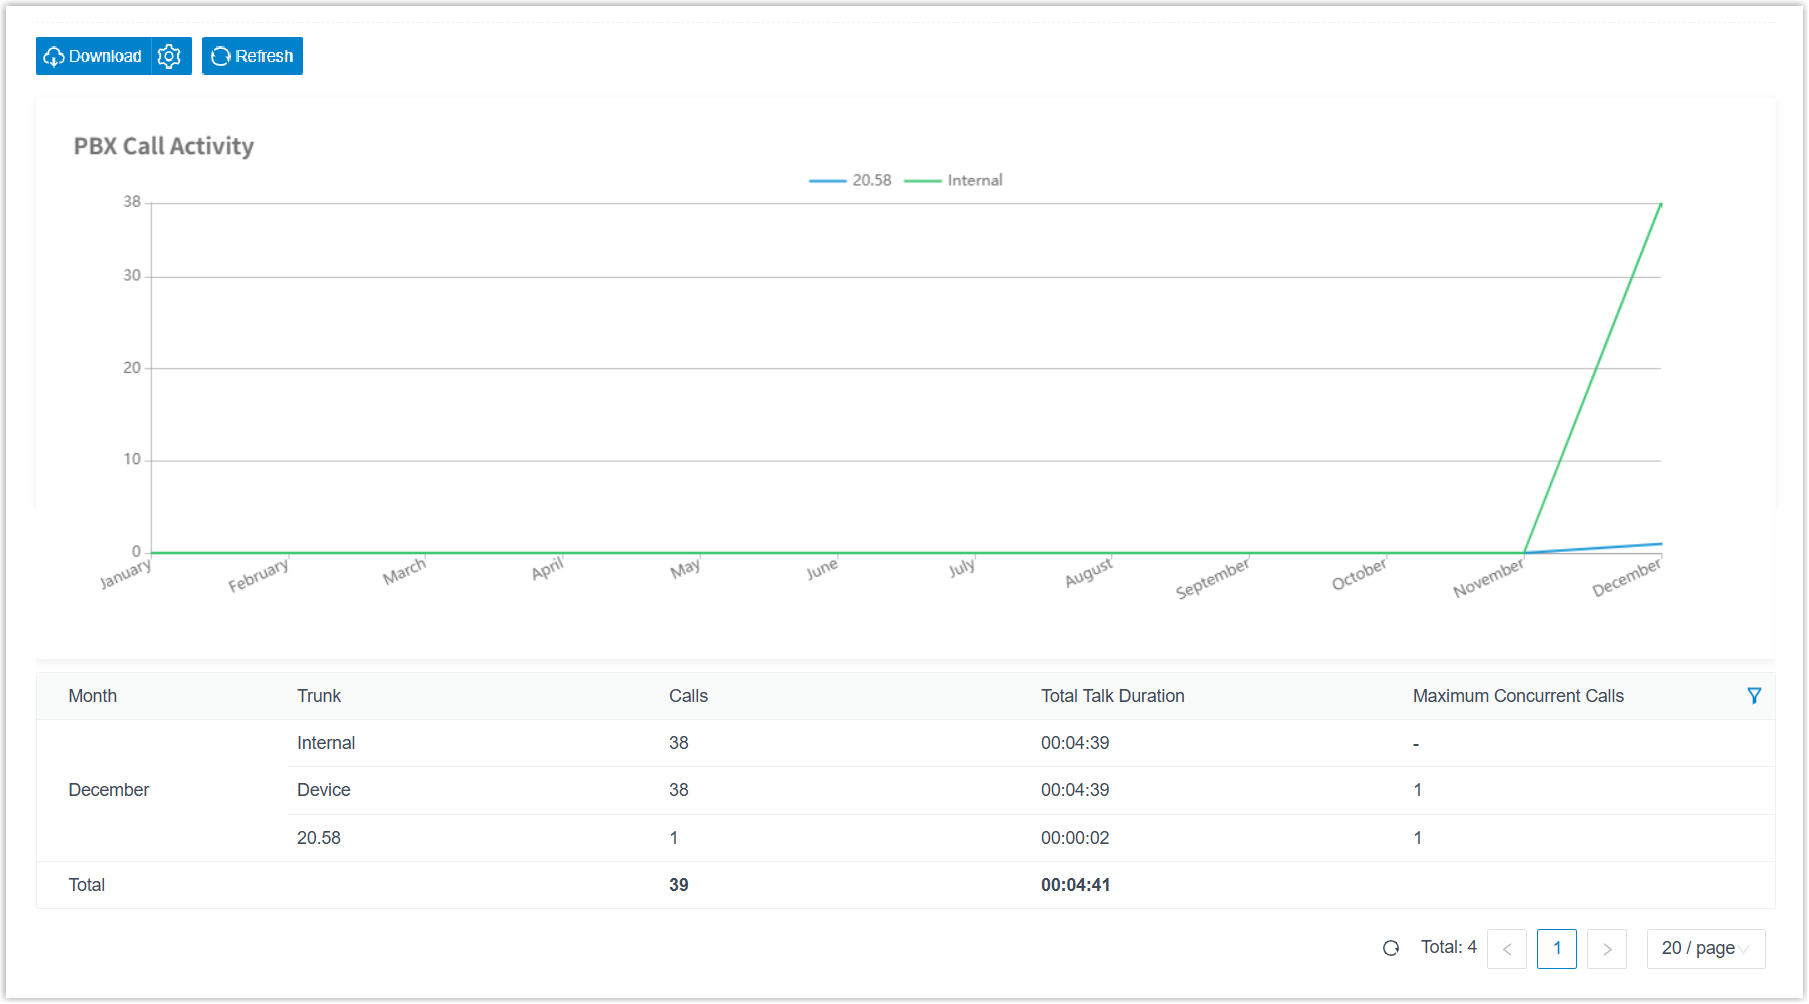
3. Set the filters that determine what the report covers.

1. Use the **Time Range** and **Select Date** fields to set the period the report should span.
2. Narrow the data by trunk, call type, or communication type. The report refreshes to show only the matching activity.
:::note
The **Communication Type** filter chooses which calls are included: internal calls only, external (trunk) calls only, or all of them. Setting it to **All** is also what adds the whole-system **Device** summary row described in [Report metrics](#report-metrics) below.
:::
4. Optional: Adjust the columns so the report focuses on the metrics you care about.
| Task | How |
|------|-----|
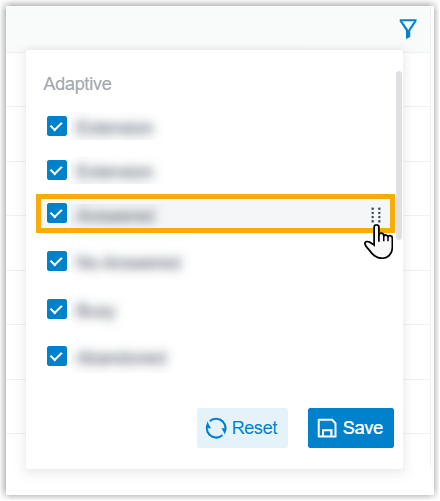
| Choose which columns appear | Click the column-filter icon, then select the columns to display.
 |
| Reorder columns | Click the drag handle next to a field and drag it to the position you want.
 |
5. Optional: Save the report for quick access later, or schedule it to be emailed automatically.
:::tip
If you review the same call activity regularly, set up your filters once and save them to **My Reports** so you do not have to rebuild them each time. For a report you need on a fixed cadence (for example, every Monday morning), use **Scheduled Reports** to have it emailed automatically instead of opening the portal to download it by hand.
:::
| Task | How |
|------|-----|
| Add to **My Reports** | Keep the report handy in your **My Reports** list.
1. At the bottom of the page, click **Add to My Reports**.
2. Give the report a name you'll recognize, and adjust the filters or metrics if needed.
3. Click **Save**. |
| Add to **Scheduled Reports** | Have the report emailed on a schedule. At the bottom of the page, click **Add to Scheduled Reports**, then complete the [scheduled task](/pbx/administrator-guide/schedule-call-reports/) settings. |
| Download the report | Save a copy to your computer for offline review and analysis.
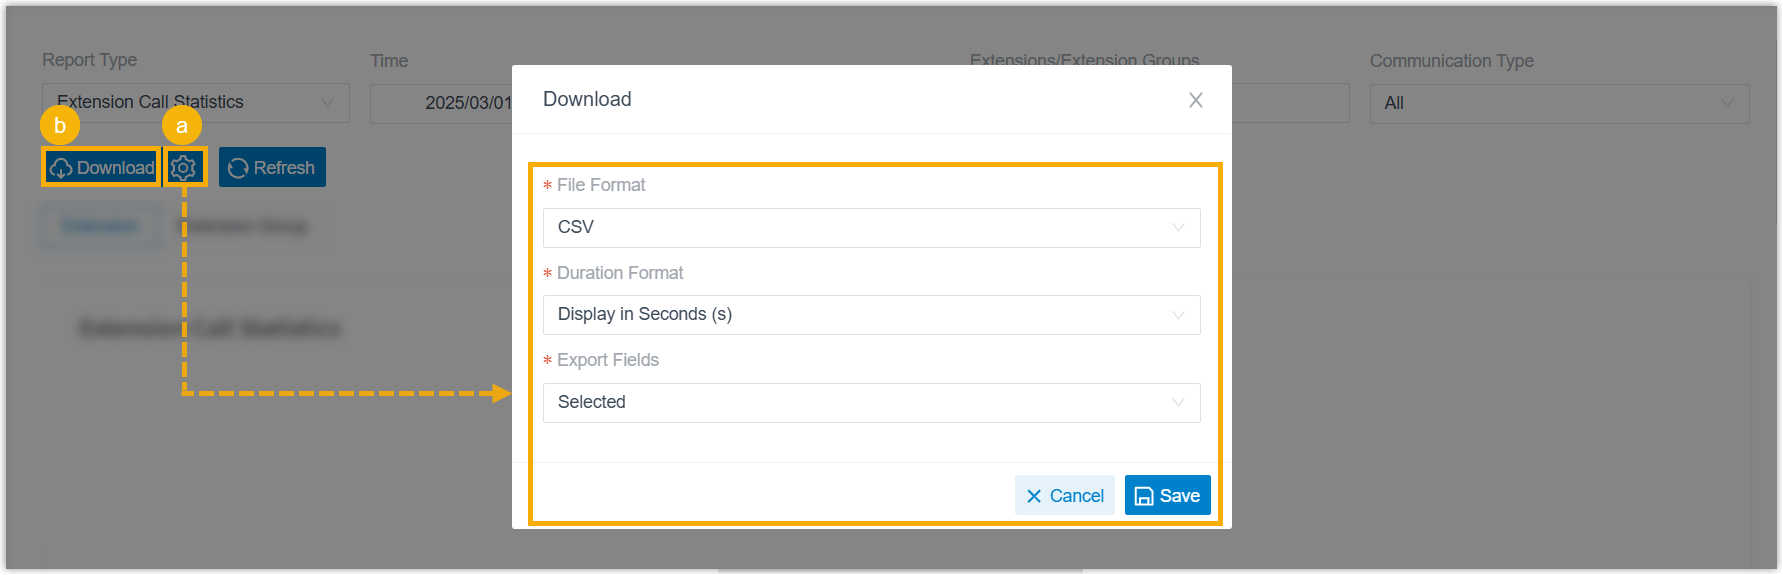
1. Optional: Click the settings icon to change the download options, then save your changes:
- **File Format**: `CSV`, `XLS`, `HTML`, or `PDF`.
- **Duration Format**: show durations **Display in Second (s)** or **Display as HH:MM:SS**.
- **Export Fields**: export **All** fields or only the **Selected** ones.
2. Click **Download**. |
## Report metrics
| Metric | Description |
|--------|-------------|
| Trunk | The trunk the activity is grouped under.
- *{trunk_name}*: calls placed or received over that trunk.
- **Internal**: calls between extensions.
- **Device**: activity for the whole system, covering internal calls plus inbound and outbound calls on every trunk. This row appears only when the **Communication Type** filter is set to **All**. |
| Calls | The number of calls placed or received. |
| Total Talk Time | The combined time from when calls were answered to when they ended. |
| Maximum Concurrent Calls | The highest number of calls active at the same time during the selected period.
- Calls between extensions and calls received over WebRTC (Web Real-Time Communication) trunks are not included in this calculation.
- When the **Trunk** value is **Device**, this figure reflects the peak concurrency for the entire phone system. |