
Dashboard Home
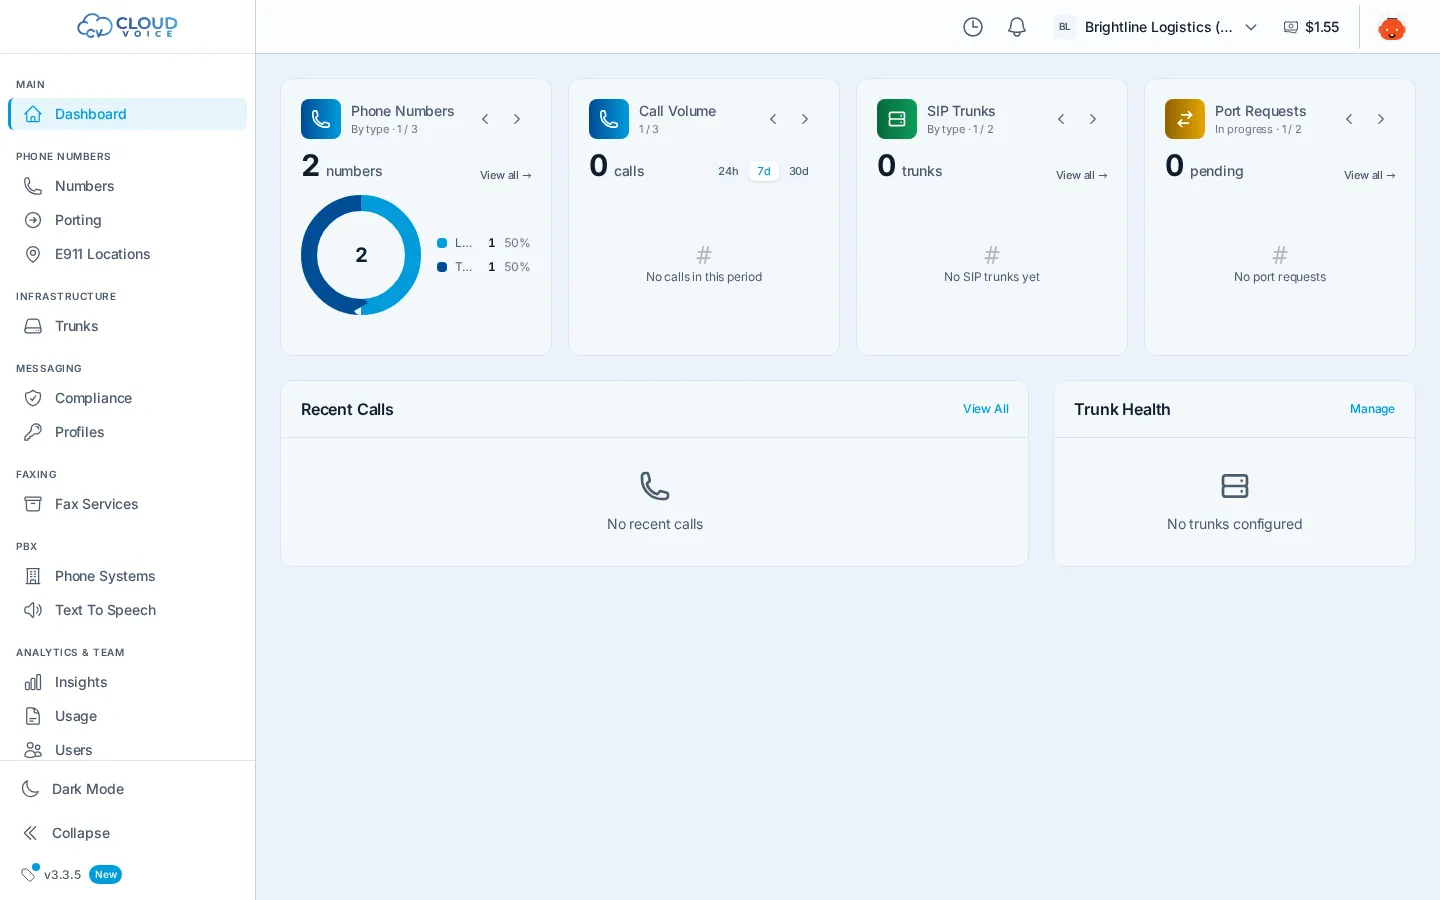
The Dashboard is the first page you land on after signing in to portal.voice.izt.cloud, a live snapshot of your account. It summarizes your numbers, trunks, pending ports, call activity, and system health so you can spot issues at a glance, then use the sidebar to drill into any area and take action.
Key metrics
Section titled “Key metrics”The stats cards at the top show live counts across your account:
- Phone numbers you own, see Phone Numbers
- SIP trunks configured, see Create a Trunk
- Pending ports in flight, see Number Porting
- Emergency locations registered, see E911 Emergency Locations
Quick-action buttons let you jump straight into adding a number or a trunk without hunting through the sidebar. A graph widget alongside the stats can be cycled through different views of your account activity.
Calls by hour
Section titled “Calls by hour”The calls-by-hour chart breaks your call volume into a 24-hour view, so you can see when your busy periods are and whether today looks normal. You can view the breakdown for a specific day.
Extension status
Section titled “Extension status”If you run a hosted phone system, the extension status widget shows the registration state of your PBX extensions, a quick way to confirm desk phones and softphones are online. When you have more than one phone system, you can scope the widget to a specific PBX. Accounts without a PBX see an empty widget; see Phone Systems (PBX) to set one up.
Recent calls
Section titled “Recent calls”The recent calls list shows the latest calls across your account with their direction (inbound or outbound), status, and timing. It’s a pulse check, not a full log, for filtering, call quality metrics, and per-call detail, head to Insights.
Trunk health
Section titled “Trunk health”The trunk health widget gives you a quick read on the registration and health of your SIP trunks. Anything degraded shows here first, so it’s the fastest place to notice a PBX that has stopped registering.
Question about this page?
Ask the AI assistant. It starts from this page, then searches the rest of the docs.
Ask Cloud Voice AI
Answers are AI-generated from the docs and may contain mistakes. Verify with the linked pages.