
Wallboard Overview
The Wallboard gives you a live picture of how your call queues are performing. This page explains who can open it, what it requires, and the different views it provides.
Requirements
Section titled “Requirements”You open the Wallboard from the Cloud Voice App. Before you begin, confirm that your client meets the requirements below.
For the web version of the Cloud Voice App, use one of the following browsers:
| Browser | Minimum version |
|---|---|
| Google Chrome (recommended) | Chrome 87 or later |
| Microsoft Edge | Edge 87 or later |
| Opera | Opera 72 or later |
For the desktop version of the Cloud Voice App, use version 1.10.2 or later.
What the Wallboard does for you
Section titled “What the Wallboard does for you”As a queue manager, the Wallboard puts every key detail about your queues in front of you as it happens. You can break performance down by day, week, or month to see how call volumes, answer rates, service level, and other measures are trending.
Each queue can have its own Wallboard, so you decide which queues to show. Displaying a Wallboard on a TV or a dedicated screen lets agents check their standing at a glance, stay aware of service level targets and daily goals, and keep their output on track.
Wallboard views
Section titled “Wallboard views”The Wallboard offers three views, each suited to a different way of reading your queue data.
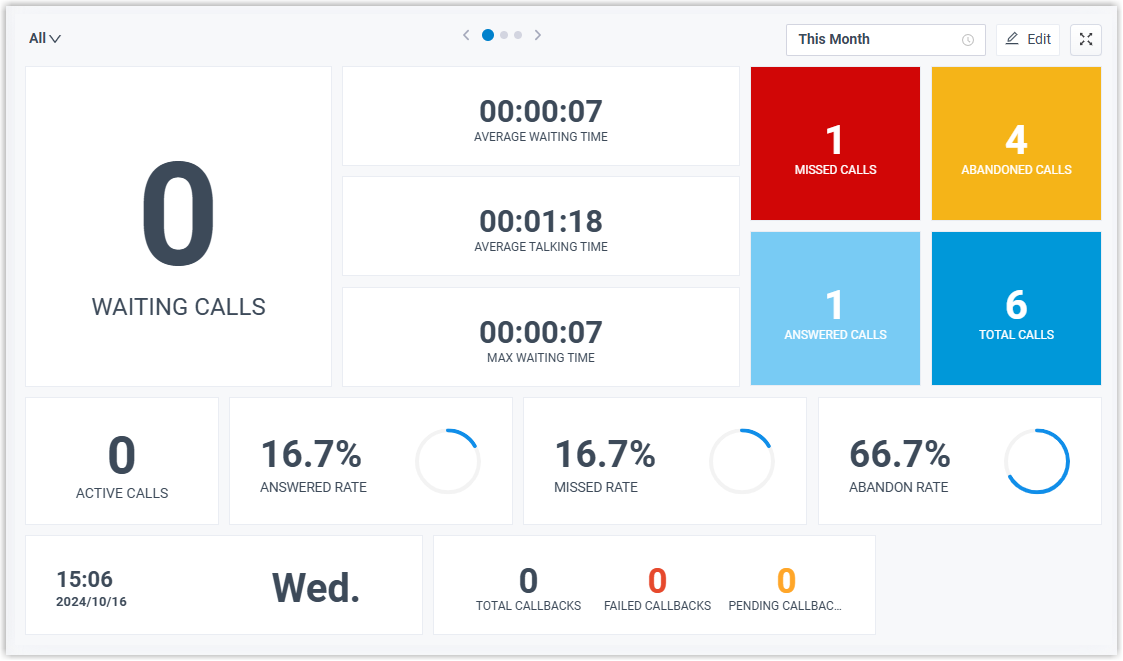
Queue call metrics
This view combines aggregated figures across all your queues with the metrics for each individual queue, giving you a fast read on the numbers that matter most.
Queue performance list
This view lays out the key performance measures as a list, which makes it straightforward to compare and analyze several queues side by side.

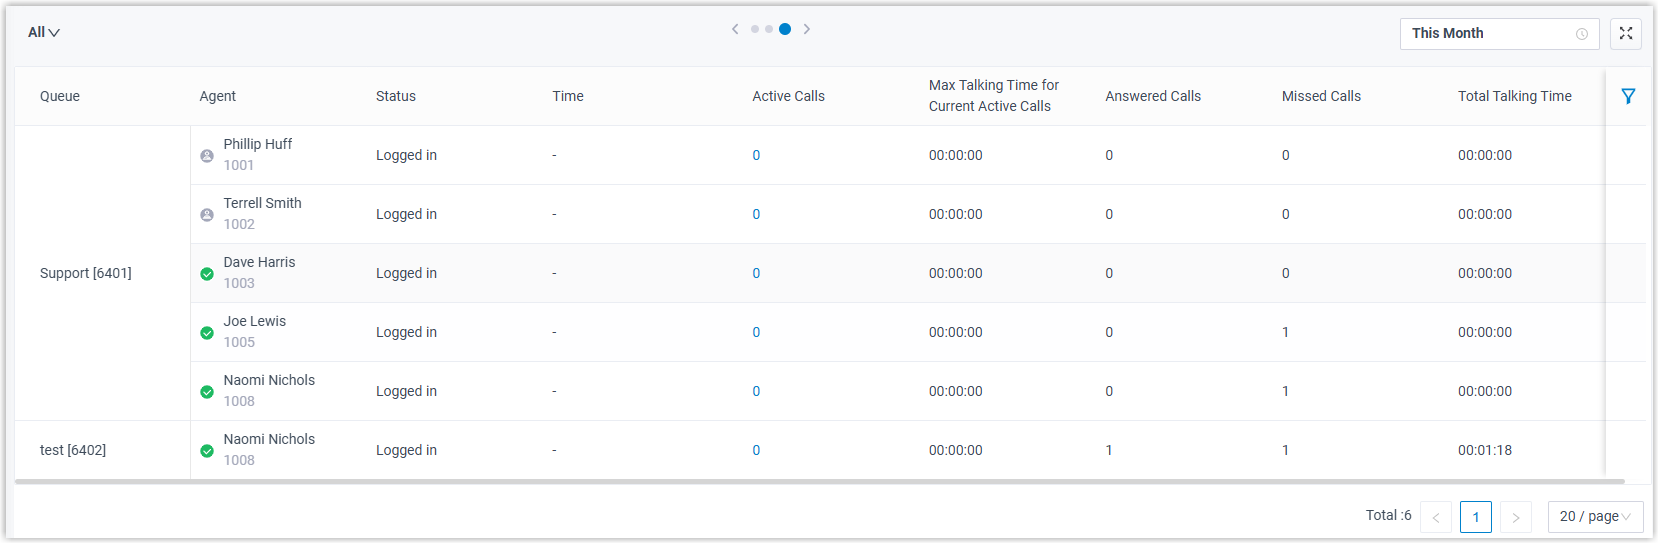
Agent status list
This view organizes your agents into a clear list so you can follow each one’s presence, whether they are logged in or out, their call totals, and more.
Question about this page?
Ask the AI assistant. It starts from this page, then searches the rest of the docs.
Ask Cloud Voice AI
Answers are AI-generated from the docs and may contain mistakes. Verify with the linked pages.