
Queue Performance Activity Report
The Queue Performance Activity report breaks down how your call queues perform over time, with hourly, daily, and monthly views of queue calls. Use it to track answer and abandon rates, wait and handle times, and service level, then drill into the individual calls behind the numbers. This page explains how to open the report and what each metric measures.
Open the Queue Performance Activity report
Section titled “Open the Queue Performance Activity report”-
Sign in to the PBX (Private Branch Exchange, your phone system’s web management console) and go to Reports and Recordings > Call Reports.
-
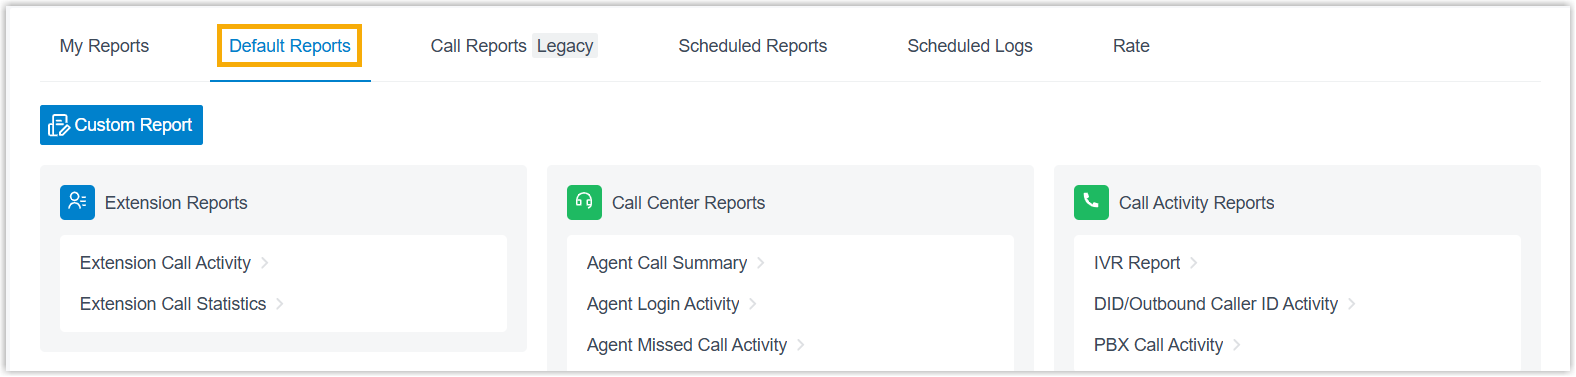
Open the Default Reports tab.
-
In the Call Center Reports pane, select Queue Performance Activity.
-
Set the report filters:

a. In the Time Range and Select Date fields, choose the period the report should cover.
b. Narrow the results using the filters below.
Filter What it does Queue Select one or more queues to include. Exclude Calls Abandoned within Xs Set a ring-time threshold in seconds. Calls that callers abandon within that window are left out of the report, so brief hang-ups don’t skew the numbers. The report matching your filters appears on the page.
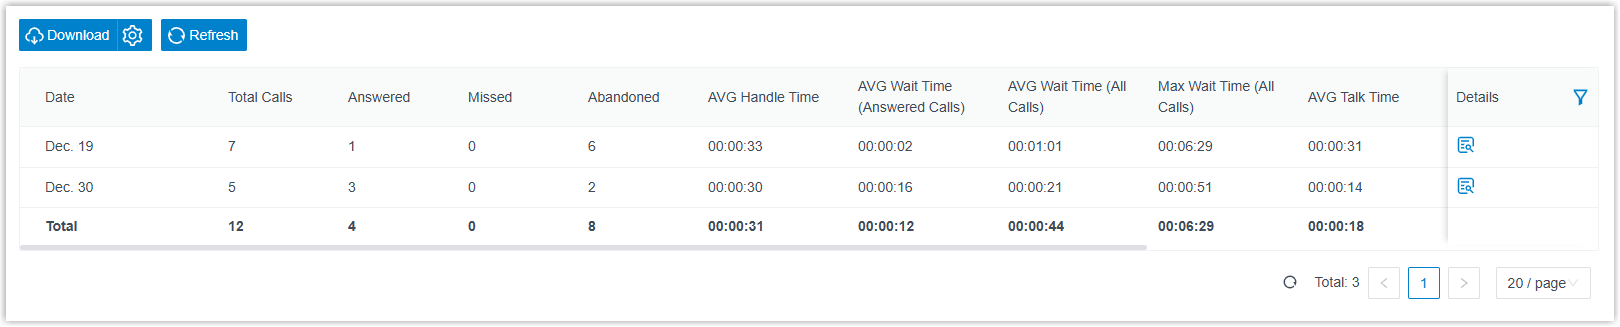
Adjust the columns
Section titled “Adjust the columns”Optionally, tailor the column layout so the indicators you care about stay in view.
| Action | How |
|---|---|
| Choose which columns appear | Click the column-selection icon, then tick the columns you want to show. |
| Freeze a column | Click the drag handle next to a field and drop it onto Left (Freeze Column) or Right (Freeze Column) to pin it in place.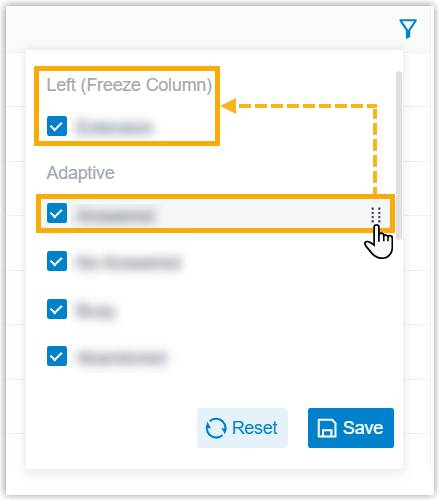 |
| Reorder columns | Click the drag handle next to a field and move it to the position you want.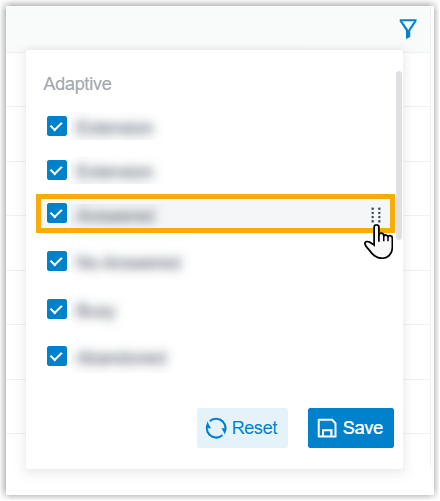 |
Save, schedule, or download the report
Section titled “Save, schedule, or download the report”Optionally, keep the report for later, have it emailed on a schedule, or export a copy.
| Action | How |
|---|---|
| Add to My Reports | Save the report to your My Reports list for quick access. At the bottom of the page, click Add to My Reports, enter a name that identifies it, fine-tune the filters or metrics, then click Save. |
| Add to Scheduled Reports | Have the report emailed automatically on a recurring basis. At the bottom of the page, click Add to Scheduled Reports, then fill in the scheduling options for the task. |
| Download the report | Export the report to your computer for offline review or further analysis. |
To control the export, click the settings icon before downloading, adjust the options below, then save your changes.
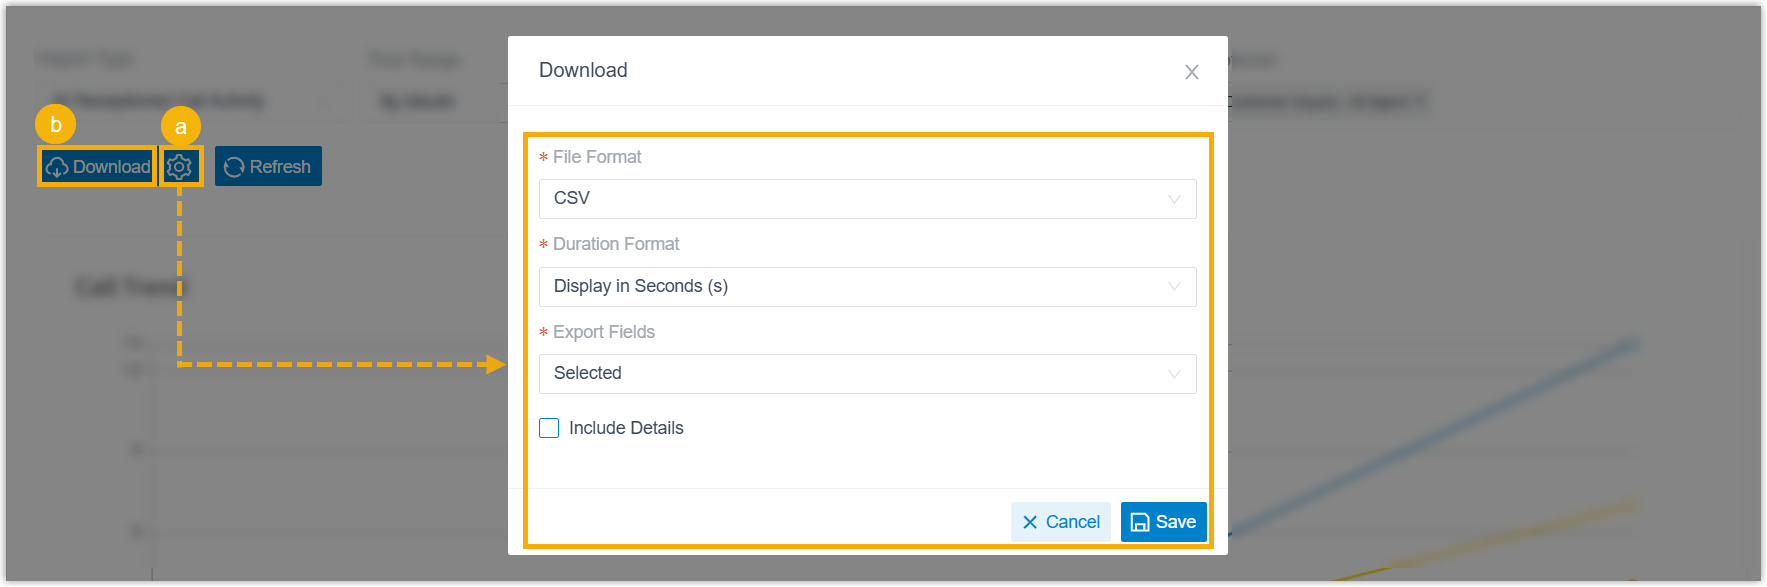
- File Format: the format of the exported file: CSV, XLS, PDF, or HTML.
- Duration Format: how every duration field is shown: Display in Second (s) or Display as HH:MM:SS.
- Export Fields: which fields to include: All or Selected.
- Include Details: whether to export the summary list only or add the underlying call records. If you include the details, choose how they appear: Download data as multiple files/sheets, or Details are displayed as indented, offset rows within the same list.
When the settings are ready, click Download.
Report metrics
Section titled “Report metrics”The report has two parts: performance totals for each queue, and the individual call log behind them.
Queue metrics
Section titled “Queue metrics”
| Metric | Description |
|---|---|
| Total Calls | Total number of calls the queue received. |
| Answered | Number of calls the queue answered. |
| Missed | Number of calls the queue missed. A call counts as missed in scenarios such as: the queue reaches its Maximum Callers limit and the call leaves the queue; the call leaves after hitting the Maximum Waiting Time; a queue manager reassigns the call to another queue or extension; or the caller presses a key to exit the queue for another destination. This list is not exhaustive. |
| Abandoned | Number of calls that callers hung up on before being answered. |
| AVG Handle Time | Average time the queue spent serving callers. |
| AVG Wait Time (Answered Calls) | Average time answered calls spent waiting in the queue before an agent picked up. |
| AVG Wait Time (All Calls) | Average time all inbound calls spent waiting in the queue, whether or not they were answered. |
| Max Wait Time (All Calls) | Longest time any caller waited in the queue, whether or not the call was answered. |
| AVG Talk Time | Average time agents spent talking to callers. |
| AVG Hold Time | Average time calls were kept on hold. |
| Answered Rate | Answered calls as a percentage of all calls received. |
| Missed Rejection Rate | Missed calls as a percentage of all calls received. |
| Abandon Rate | Abandoned calls as a percentage of all calls received. |
| SLA | The queue’s Service Level Agreement (SLA): the percentage of conversations answered within a defined target time. |
Queue call metrics
Section titled “Queue call metrics”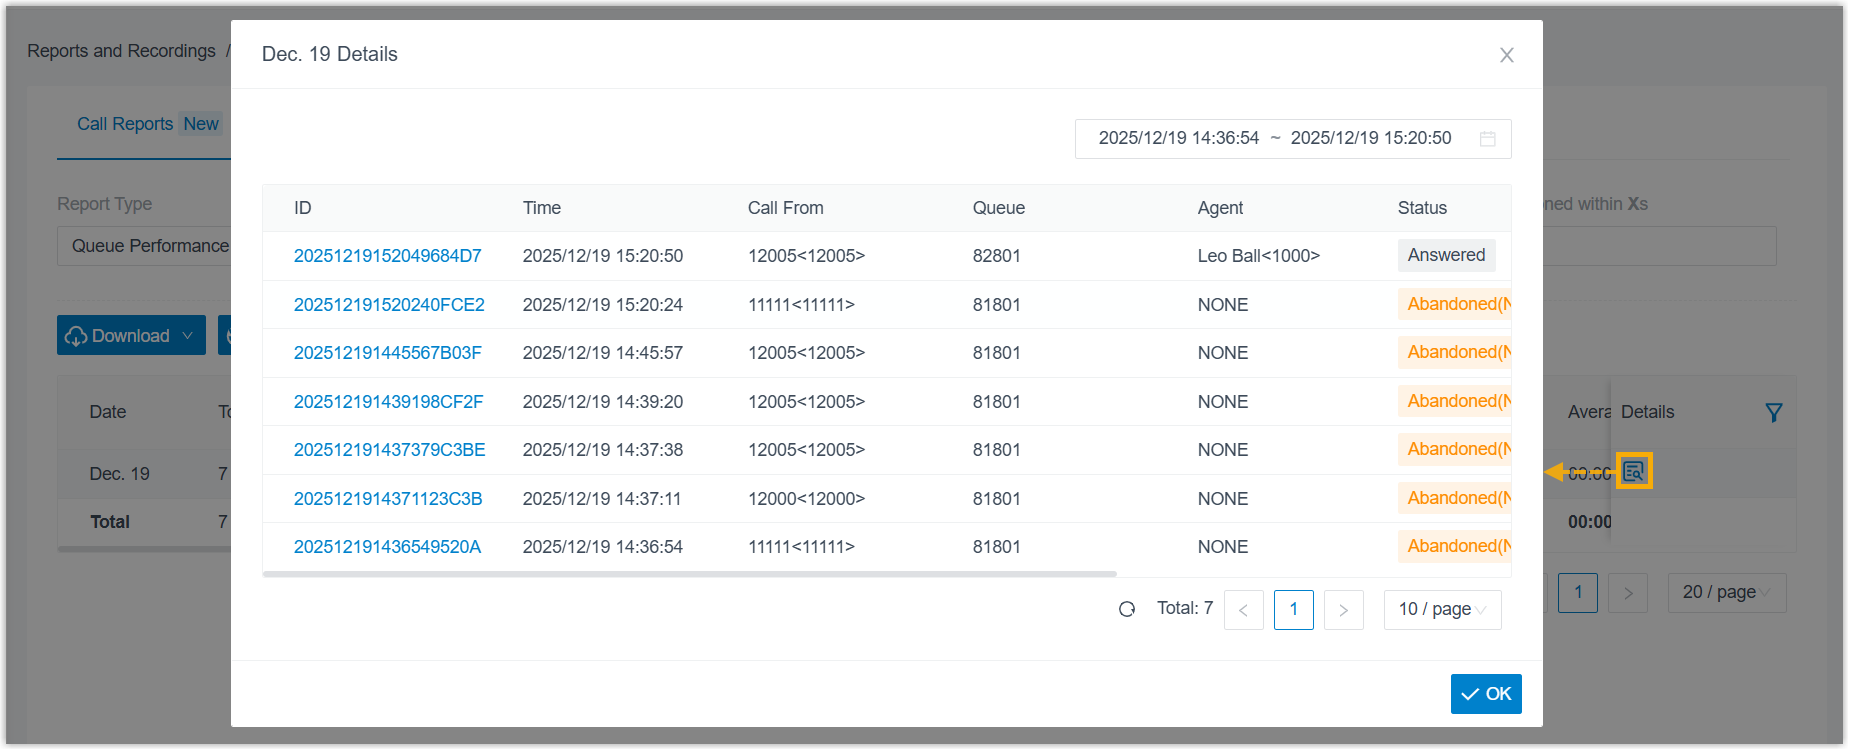
| Metric | Description |
|---|---|
| ID | A unique identifier for the call. |
| Time | When the call came in. |
| Call From | The caller’s number and name. |
| Queue | The queue that received the call. |
| Agent | The agent who answered the call. If the call went unanswered, NONE appears. |
| Status | The call outcome: Answered, Abandoned, or Missed. |
| Ring Duration | For answered calls, the time from when the call started to when it was answered. For abandoned or missed calls, the time from when the call started to when it disconnected. |
| Talk Duration | The time from when the call was answered to when it ended. |
| Hold Duration | The total time the call was on hold. |
Question about this page?
Ask the AI assistant. It starts from this page, then searches the rest of the docs.
Ask Cloud Voice AI
Answers are AI-generated from the docs and may contain mistakes. Verify with the linked pages.