
View Queue Statistics on Wallboard
The Wallboard is a real-time dashboard for anyone who oversees one or more queues. It rolls up call volume, wait and talk times, answer and abandon rates, and agent status so you can gauge how each queue is performing at a glance. This page explains how to open the Wallboard and read its three views.
Requirements
Section titled “Requirements”- Your Cloud Voice system runs firmware 84.19.0.70 or later.
- If you use the desktop app, it is version 1.13.3 or later.
Before you begin
Section titled “Before you begin”Confirm that:
- You are a queue manager, or an agent who has been granted wallboard access.
- You can sign in to the Cloud Voice App (Web or Desktop).
- You have your sign-in credentials and, for the desktop app, the server details (domain name, or IP addresses and ports) from your system administrator.
Open the Wallboard
Section titled “Open the Wallboard”You can open the Wallboard from either the web or the desktop version of the Cloud Voice App.
-
Sign in to the Cloud Voice App using these details:
- Username: your extension number or email address.
- Password: your extension user password.
- Domain (desktop app only): enter the domain name, or click the server settings icon
 to enter the server IP addresses and ports instead.
-
Go to Call Center Console > Wallboard.
Choose a view and scope the statistics
Section titled “Choose a view and scope the statistics”The Wallboard presents your queue data in three ways. Use the queue selector in the top-left corner to scope the data to a single queue, a group, or all queues, and the time-range selector in the top-right corner to set the reporting period. The sections below cover each view:
Wallboard view: queue call metrics
Section titled “Wallboard view: queue call metrics”The default Wallboard view lays out call metrics as widgets, showing either the combined totals for every queue or the figures for one queue you pick.
-
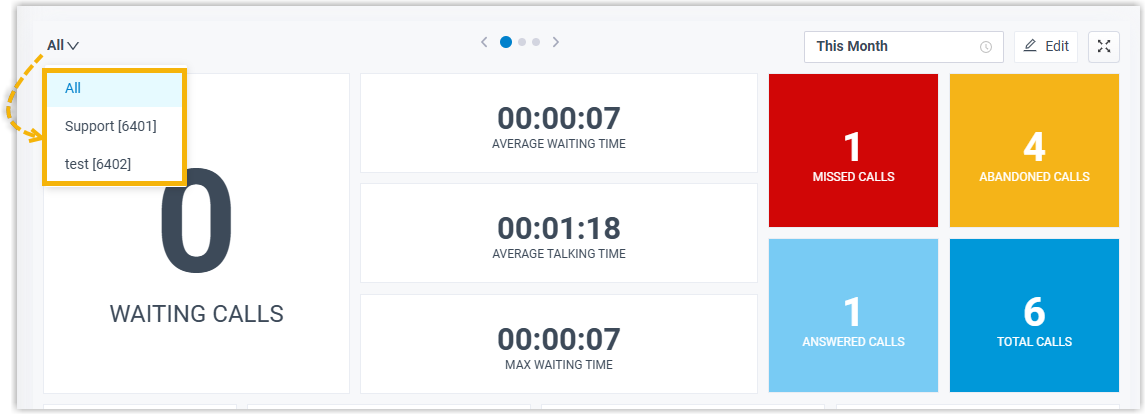
In the top-left corner, select the queue you want, or choose All for combined statistics.
-
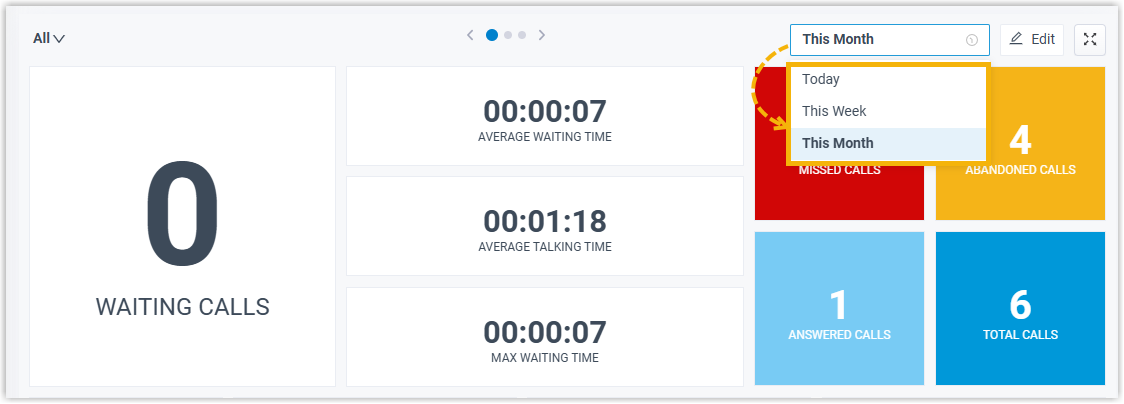
In the top-right corner, choose the reporting period.
The widgets update with the call statistics for your selection.
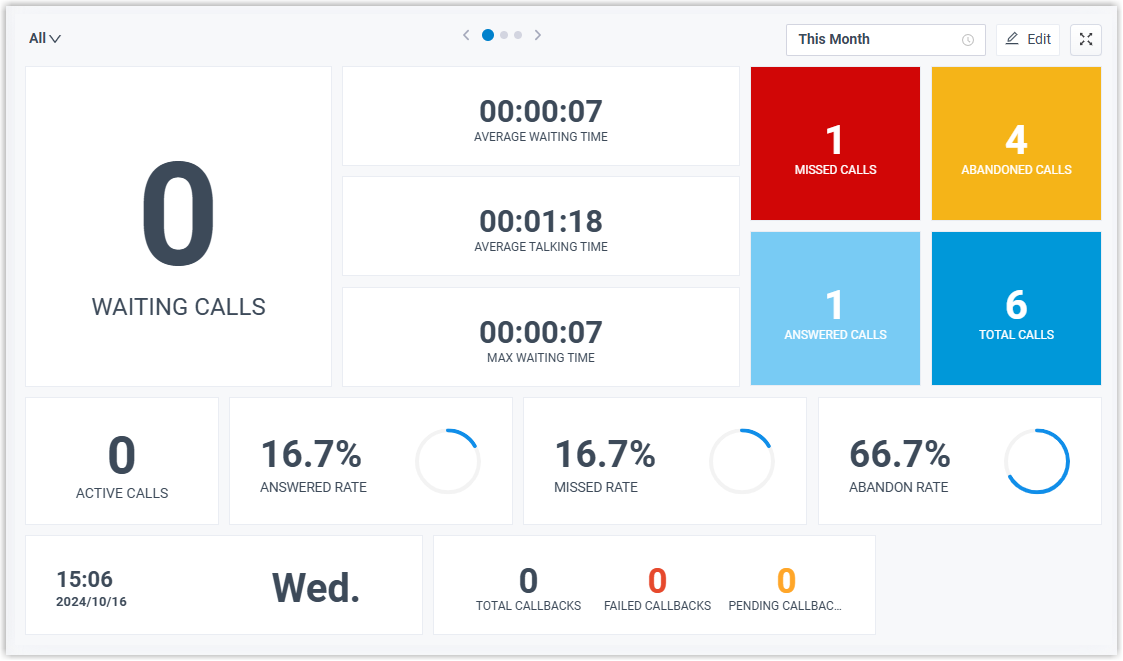
The widgets show the following metrics:
| Widget | What it shows |
|---|---|
| DATE & TIME | The current date and time on your Cloud Voice system. |
| AVERAGE WAITING TIME | The average time answered callers waited in the queue during the period. |
| AVERAGE TALKING TIME | The average time agents spent talking to callers. |
| MAX WAITING TIME | The longest an answered call waited during the period. |
| WAITING CALLS | The number of calls currently holding in the queue. |
| ACTIVE CALLS | The number of calls the queue is currently handling. |
| ANSWERED CALLS | The total calls the queue answered during the period. |
| TOTAL CALLS | Every call the queue received during the period. |
| MISSED CALLS | The total calls the queue did not answer during the period. |
| ABANDONED CALLS | The total calls that callers hung up before an agent answered. |
| ANSWERED RATE | The percentage of the queue’s calls that were answered during the period. |
| MISSED RATE | The percentage of the queue’s calls that went unanswered during the period. |
| ABANDON RATE | The percentage of the queue’s calls that were abandoned during the period. |
| CALL BACKS | Callback figures for the period: TOTAL CALLBACKS (callback requests callers placed successfully), FAILED CALLBACKS (callback attempts that did not connect), and PENDING CALLBACKS (callbacks still waiting to be made). |
List view: queue performance metrics
Section titled “List view: queue performance metrics”This view lines up the key performance figures for every queue in a table, which makes it easy to compare queues side by side.
-
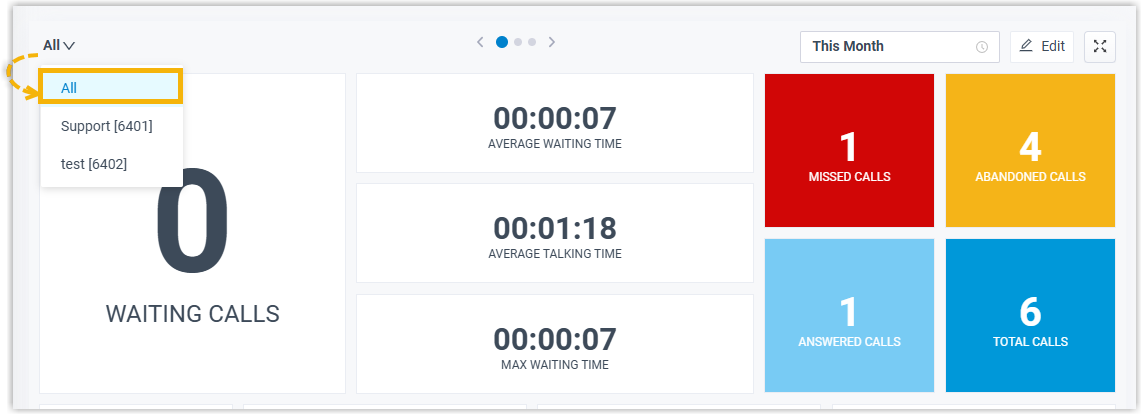
In the top-left corner, select All.
-
In the top-right corner, choose the reporting period.
-
At the top of the Wallboard, click the toggle button to switch to the list view.

The table lists these metrics for each queue:
| Column | What it shows |
|---|---|
| Agents Logged In | The number of agents logged in to the queue, out of the total number of agents. |
| Available Agents | The number of logged-in agents ready to take a call. |
| Active Calls | The number of calls the queue is currently handling. |
| Waiting Calls | The number of calls currently holding in the queue. |
| Average Talking Time | The average time agents spent talking to callers. |
| Average Waiting Time | The average time answered callers waited in the queue during the period. |
| Max Waiting Time | The longest an answered call waited during the period. |
| SLA | The queue’s Service Level Agreement figure. |
| Missed Calls | The total calls the queue did not answer during the period. |
| Abandoned Calls | The total calls that callers abandoned during the period. |
| Answered Calls | The total calls the queue answered during the period. |
| Total Calls | Every call the queue received during the period. |
| Missed Rate | The percentage of the queue’s calls that went unanswered during the period. |
| Abandon Rate | The percentage of the queue’s calls that were abandoned during the period. |
| Answered Rate | The percentage of the queue’s calls that were answered during the period. |
| Callbacks | Callback figures for the period: Total Callbacks (callback requests callers placed successfully), Failed Callbacks (callback attempts that did not connect), and Pending Callbacks (callbacks still waiting to be made). |
List view: agent status
Section titled “List view: agent status”This view tracks each agent’s presence, queue login state, and personal call figures in a single table.
-
In the top-left corner, select the queue you want.
-
In the top-right corner, choose the reporting period.
-
At the top of the Wallboard, click the toggle button to switch to the list view.
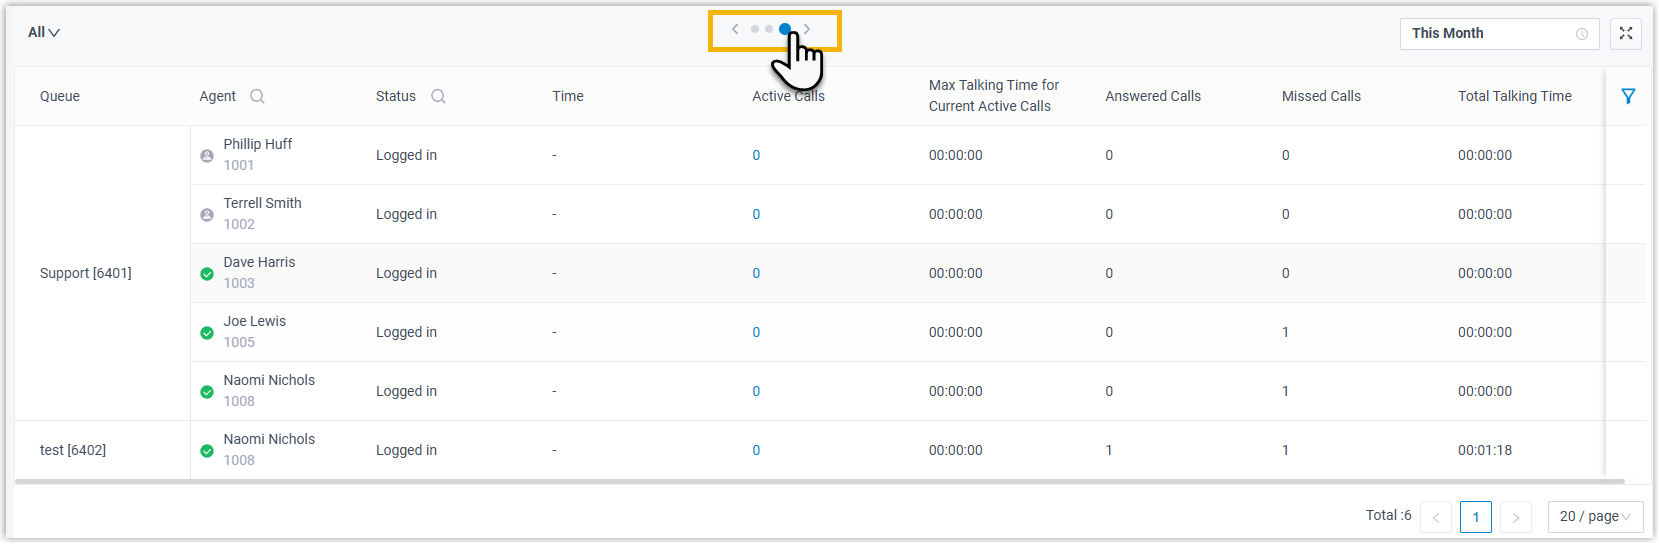
The table shows the following for each agent:
| Column | What it shows |
|---|---|
| Queue | The queues you manage. |
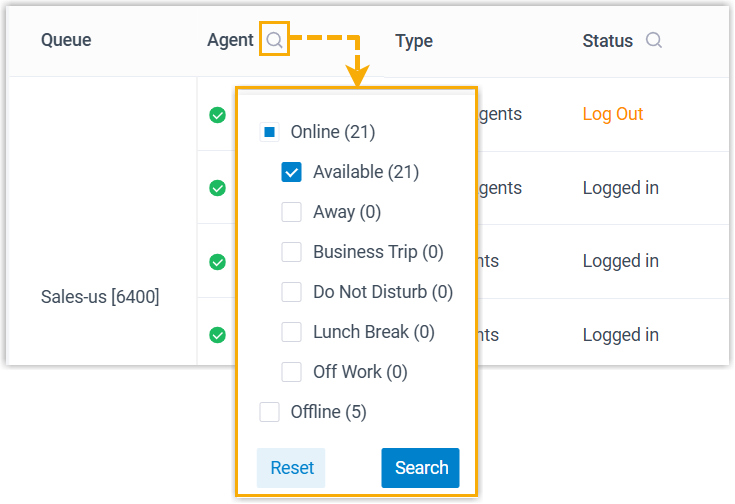
| Agent | The agent’s name, extension number, and extension presence. You can filter the list by extension online status. |
| Type | The agent type. |
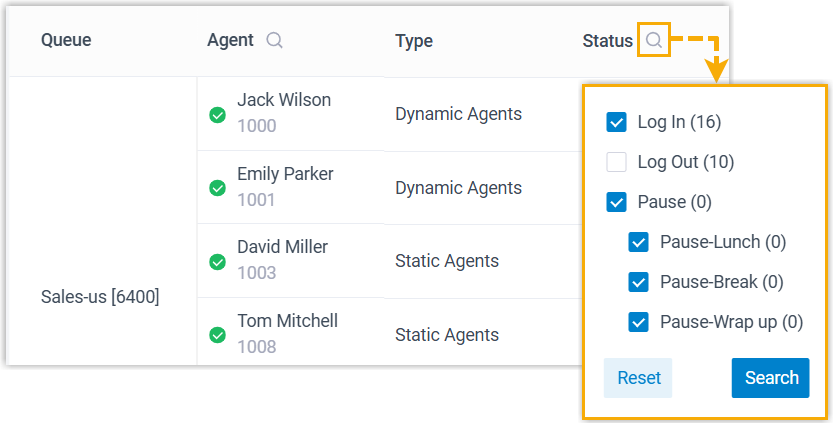
| Status | The agent’s current status. You can filter the list by status. |
| Time | The duration tied to the current status (see the notes below). |
| Active Calls | The number of queue calls the agent is currently on. |
| Max Talking Time for Current Active Calls | The longest the agent has been talking among their current queue calls. |
| Answered Calls | The total calls the agent answered during the period. |
| Missed Calls | The total calls the agent missed during the period. |
| Total Talking Time | The agent’s total talk time on queue calls during the period. |
To filter by extension online status, use the control in the Agent column:
To filter by agent status, use the control in the Status column:
What the Time column shows depends on the agent’s status:
- Logged in: the last time a dynamic agent logged in to the queue.
- Log Out: the last time a dynamic agent logged out of the queue.
- Paused: how long the agent has paused service.
Display the Wallboard in its own window (optional)
Section titled “Display the Wallboard in its own window (optional)”You can pop the Wallboard out into a separate browser window and, if you like, have it cycle between views on its own.
-
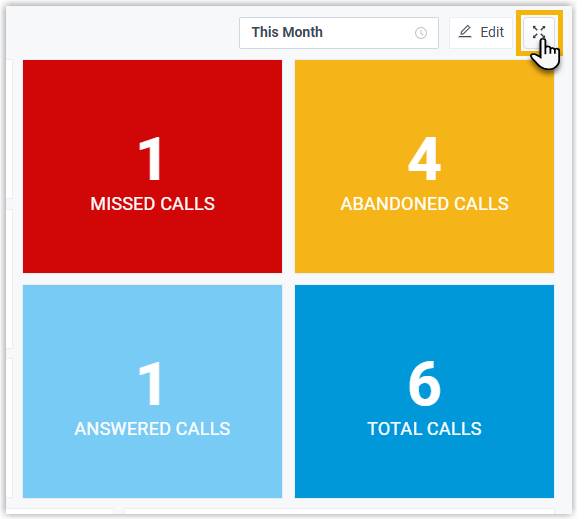
In the top-right corner, click the expand icon
 .
.
-
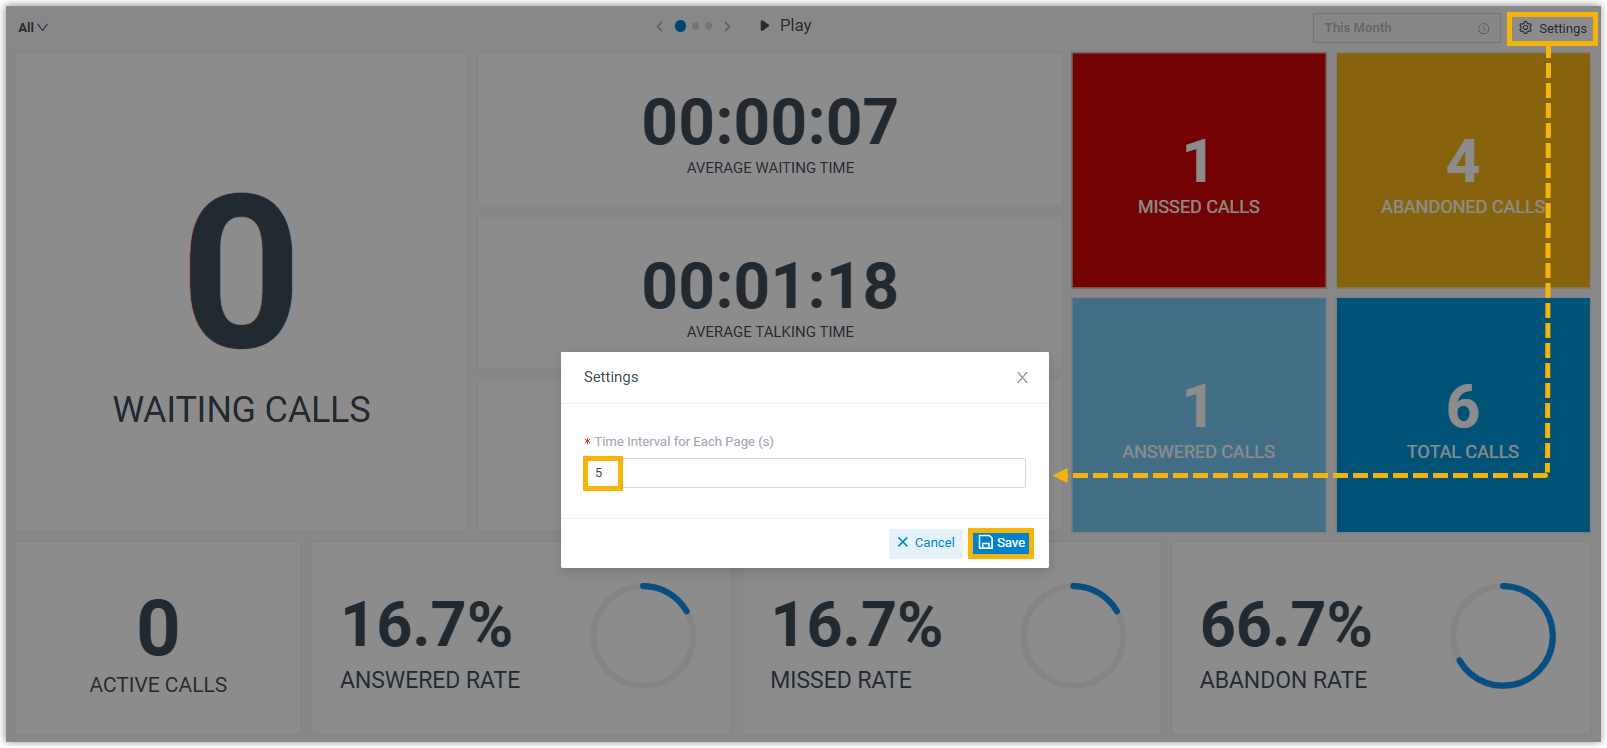
Optional: Set the Wallboard to rotate automatically between the wallboard view and the list view with a scrolling display.
a. In the top-right corner, click Settings, set the interval at which the views should switch, and save.
b. At the top of the Wallboard, click Play.
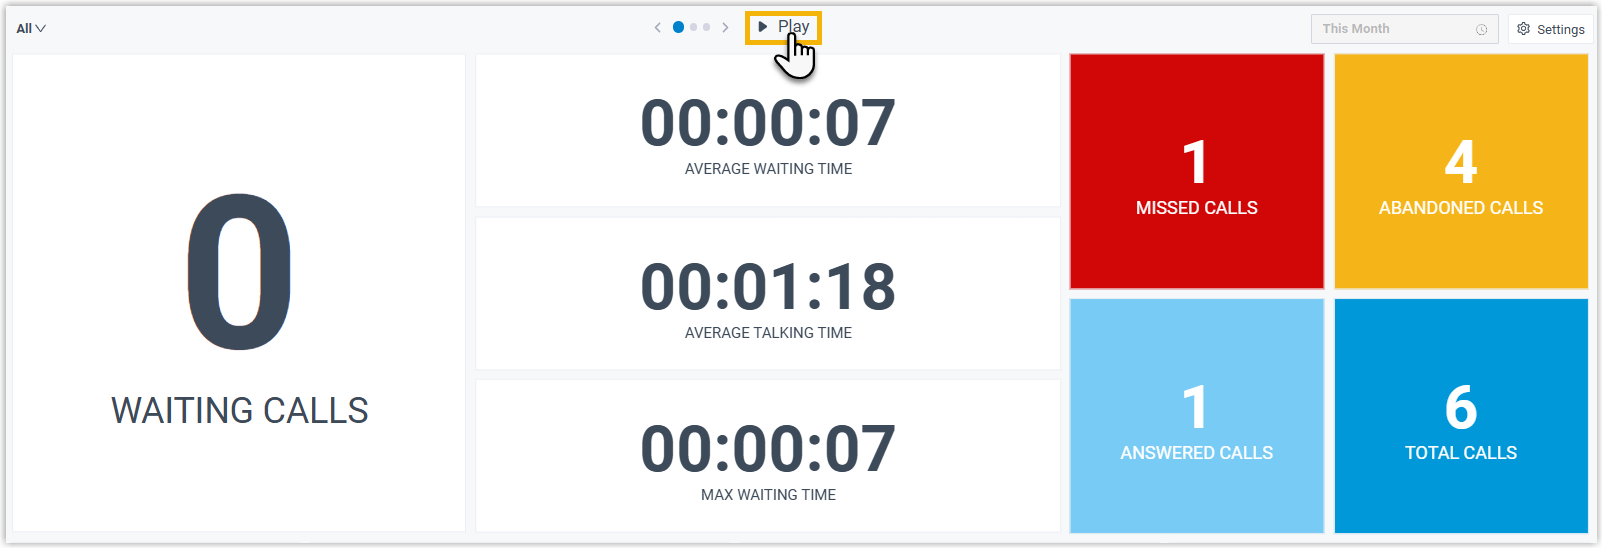
The Wallboard now cycles between the wallboard view and the list view at the interval you set.
Question about this page?
Ask the AI assistant. It starts from this page, then searches the rest of the docs.
Ask Cloud Voice AI
Answers are AI-generated from the docs and may contain mistakes. Verify with the linked pages.