
Access and Use Queue Panel
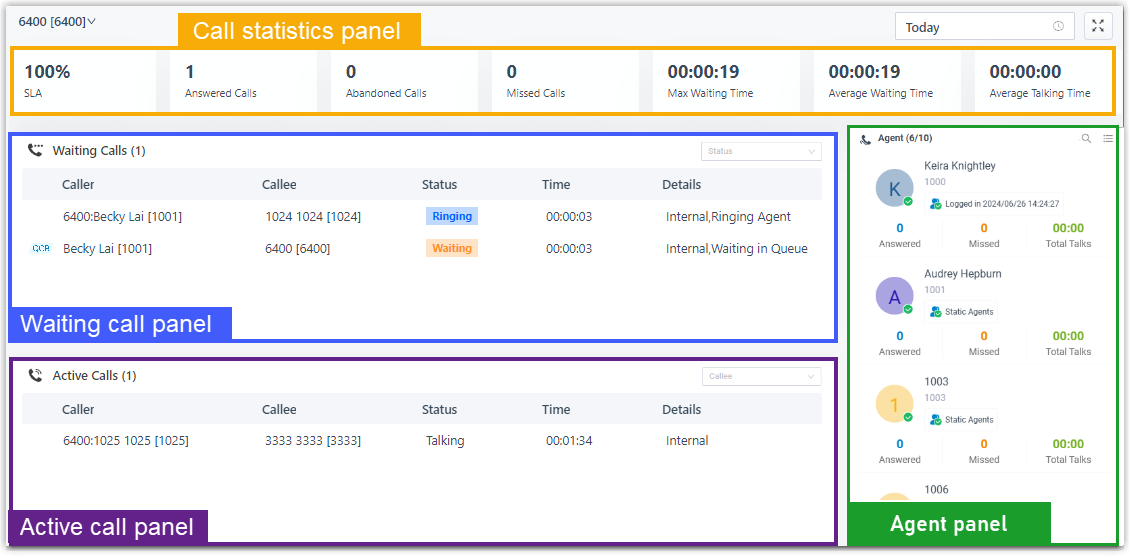
The Queue Panel gives a queue manager a real-time view of how one or more queues are performing. From a single screen you can read call statistics, act on calls that are waiting or in progress, and keep track of every agent’s availability. This page explains how to open the panel and what each part of it shows.
Before you begin
Section titled “Before you begin”Confirm the following are in place:
- The Cloud Voice server is running firmware 84.19.0.70 or later.
- The Cloud Voice App you use to open the panel meets the minimum version below.
| Client | Requirement | |
|---|---|---|
| Cloud Voice Web App | Google Chrome (recommended) | Chrome 87 or later |
| Microsoft Edge | Edge 87 or later | |
| Opera | Opera 72 or later | |
| Cloud Voice Desktop App | Version 1.13.3 or later |
Open the Queue Panel
Section titled “Open the Queue Panel”-
Sign in to the Cloud Voice App (Web or Desktop) and go to Call Center Console > Queue Panel.
-
If you manage more than one queue, choose which queues to display. The statistics on the panel update to match your selection.
A single queue
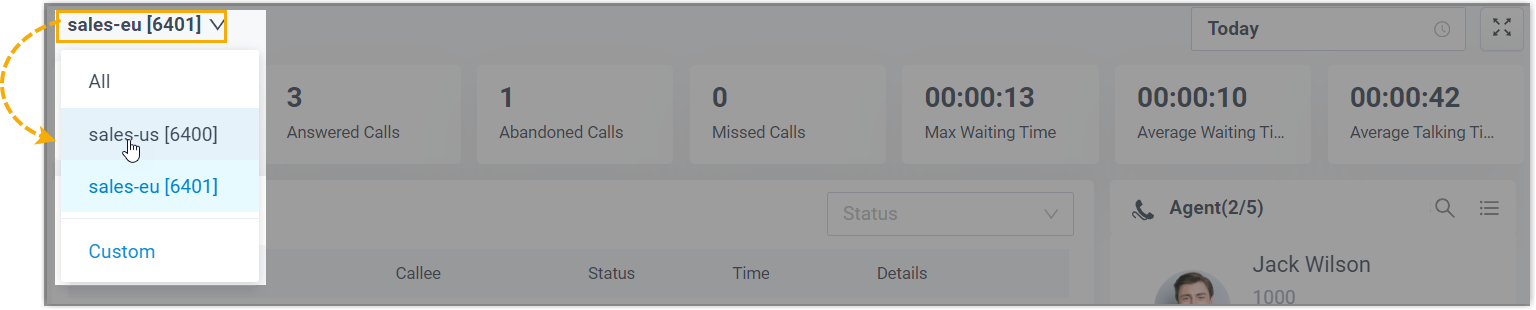
a. In the top-left corner of the panel, click the current queue.
b. Pick the queue you want from the drop-down list.
A group of queues
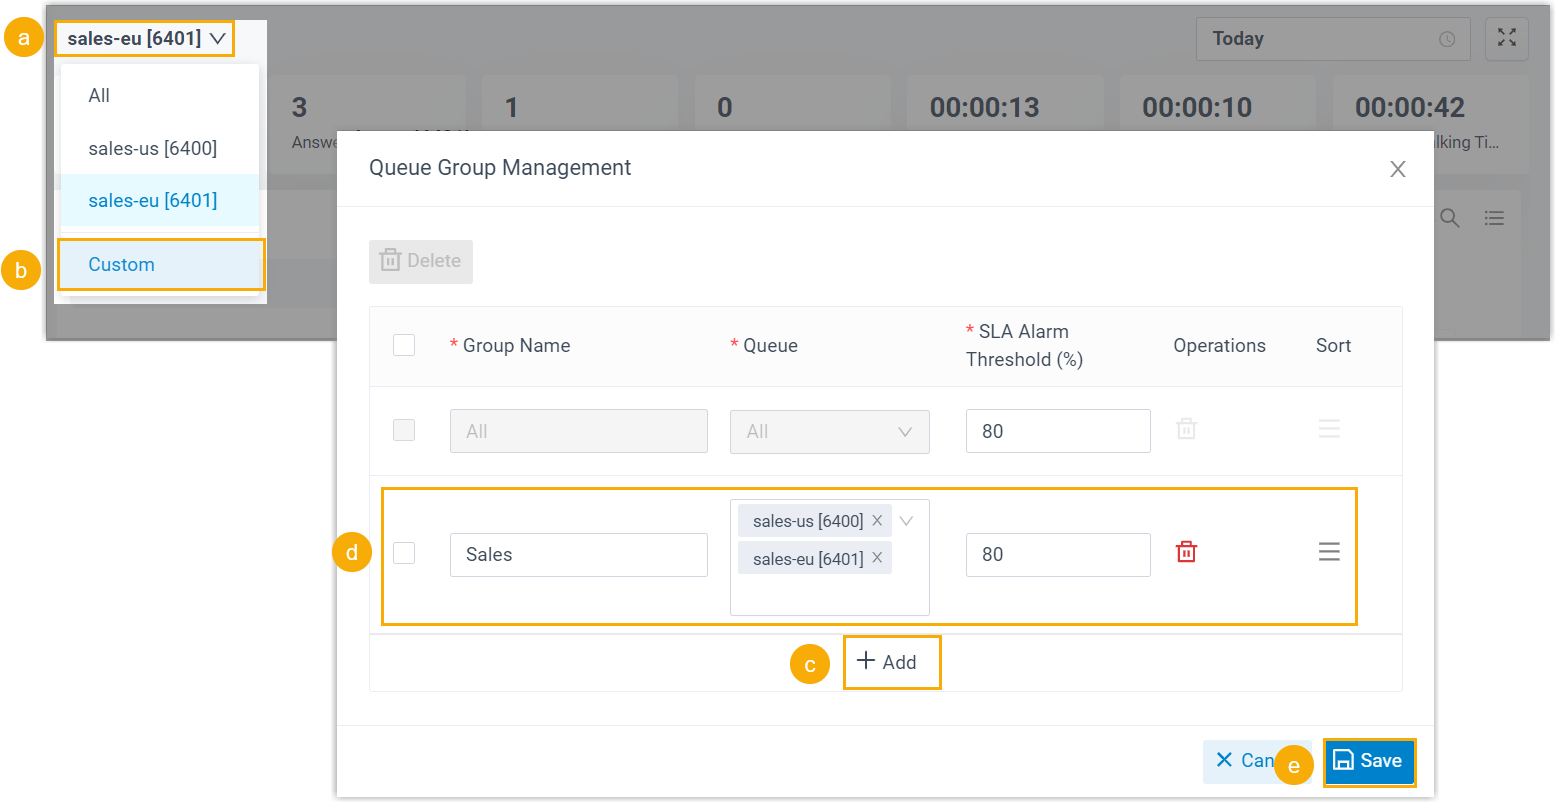
a. In the top-left corner of the panel, click the current queue.
b. In the drop-down list, select Custom.
c. In the window that opens, click Add to create a queue group.
d. Set up the group:
- Group Name: Give the group a name you’ll recognize.
- Queue: From the drop-down list, choose the queues to include.
- SLA Alarm Threshold (%): Set the SLA (Service Level Agreement) rate that triggers an alert. SLA here is the percentage of calls answered within your target response time. If the queue falls below this figure, the panel raises an alert.
- Sort: Optional. Change where the group appears in the queue list.
e. Click Save.
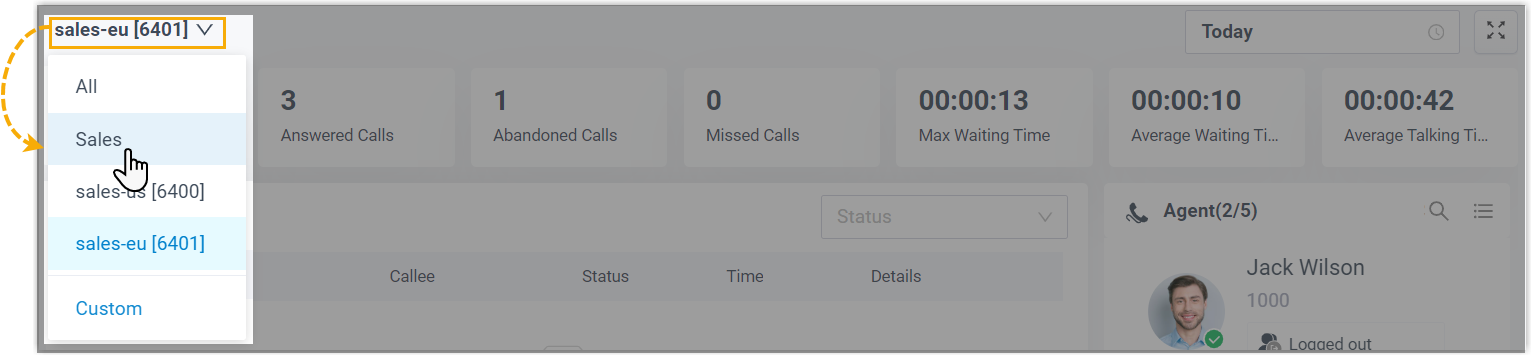
f. In the drop-down list, select the queue group.
All queues
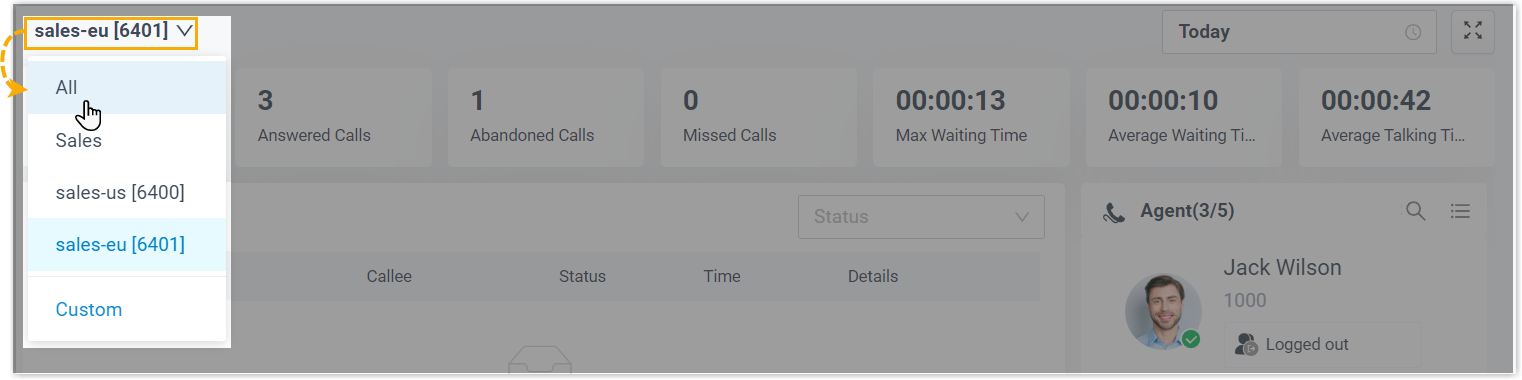
a. In the top-left corner of the panel, click the current queue.
b. In the drop-down list, select All.
-
Choose a time range for the statistics:
- Today: Figures for the current day.
- This Week: Figures for the current week.
- This Month: Figures for the current month.

-
Optional: Click
 to open the panel in its own browser window. This lets you watch several queues side by side, for example, the Service queue in one window and the Sales queue in another.
 -
Review and manage calls and statistics in each part of the panel.
Call statistics panel
Section titled “Call statistics panel”This panel summarizes call activity for the queues and time range you selected.

| Metric | What it shows |
|---|---|
| SLA | The share of calls answered within the queue’s target response time. |
| Answered Calls | The total number of calls agents answered during the period. |
| Abandoned Calls | The total number of calls abandoned during the period. |
| Missed Calls | The total number of calls the queue missed during the period. |
| Max Waiting Time | The longest a caller waited among all answered calls in the period. |
| Average Waiting Time | The average wait across all queue calls in the period. |
| Average Talking Time | The average talk time across all queue calls in the period. |
Waiting call panel
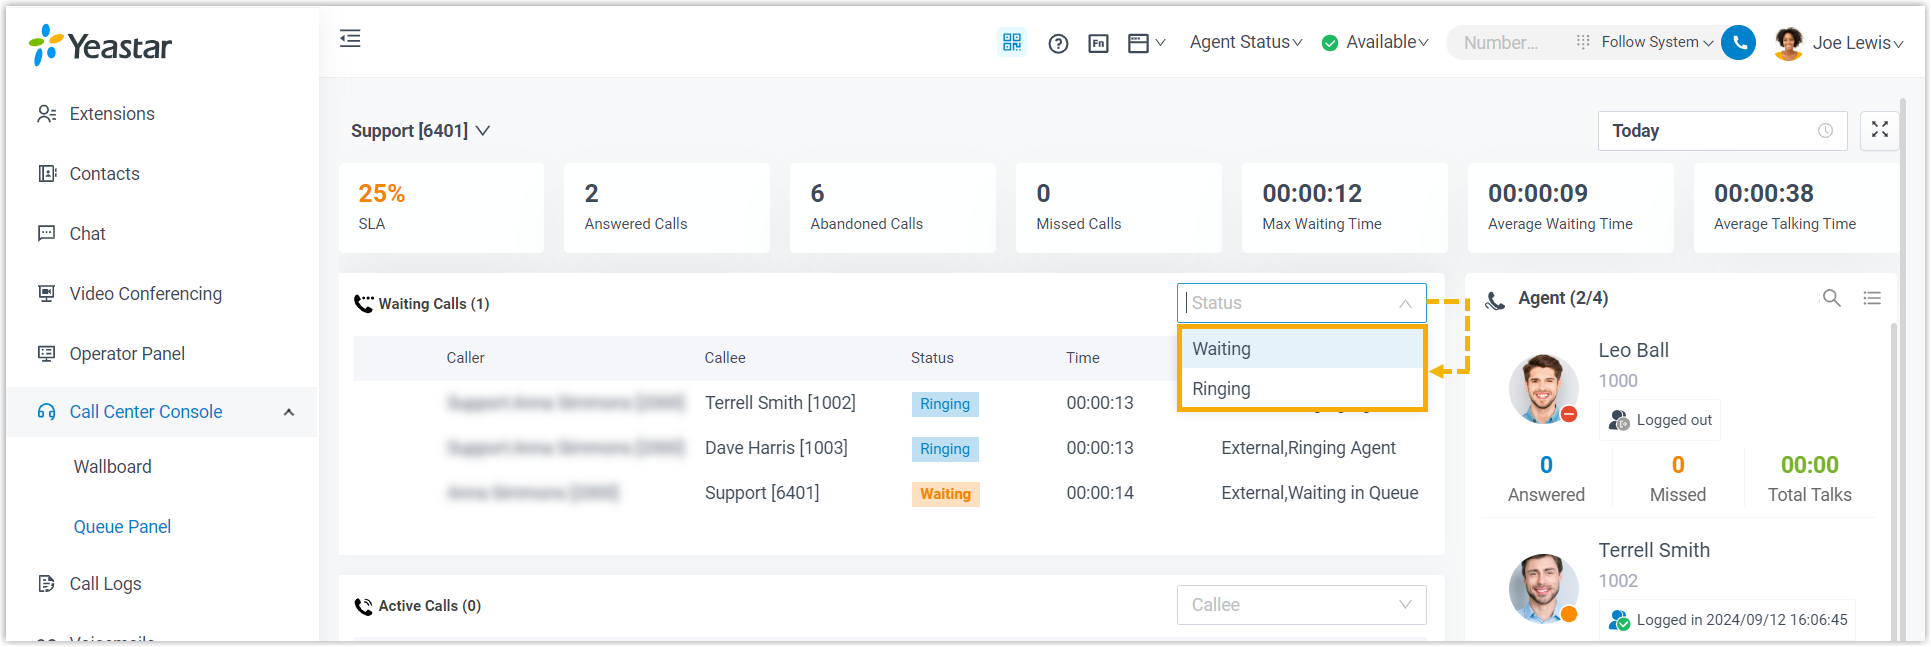
Section titled “Waiting call panel”This panel lists every incoming call that is currently ringing or waiting, in real time. For each call you can see the caller, callee, queue, status, time, and further details, and you can act on the call as needed.
Active call panel
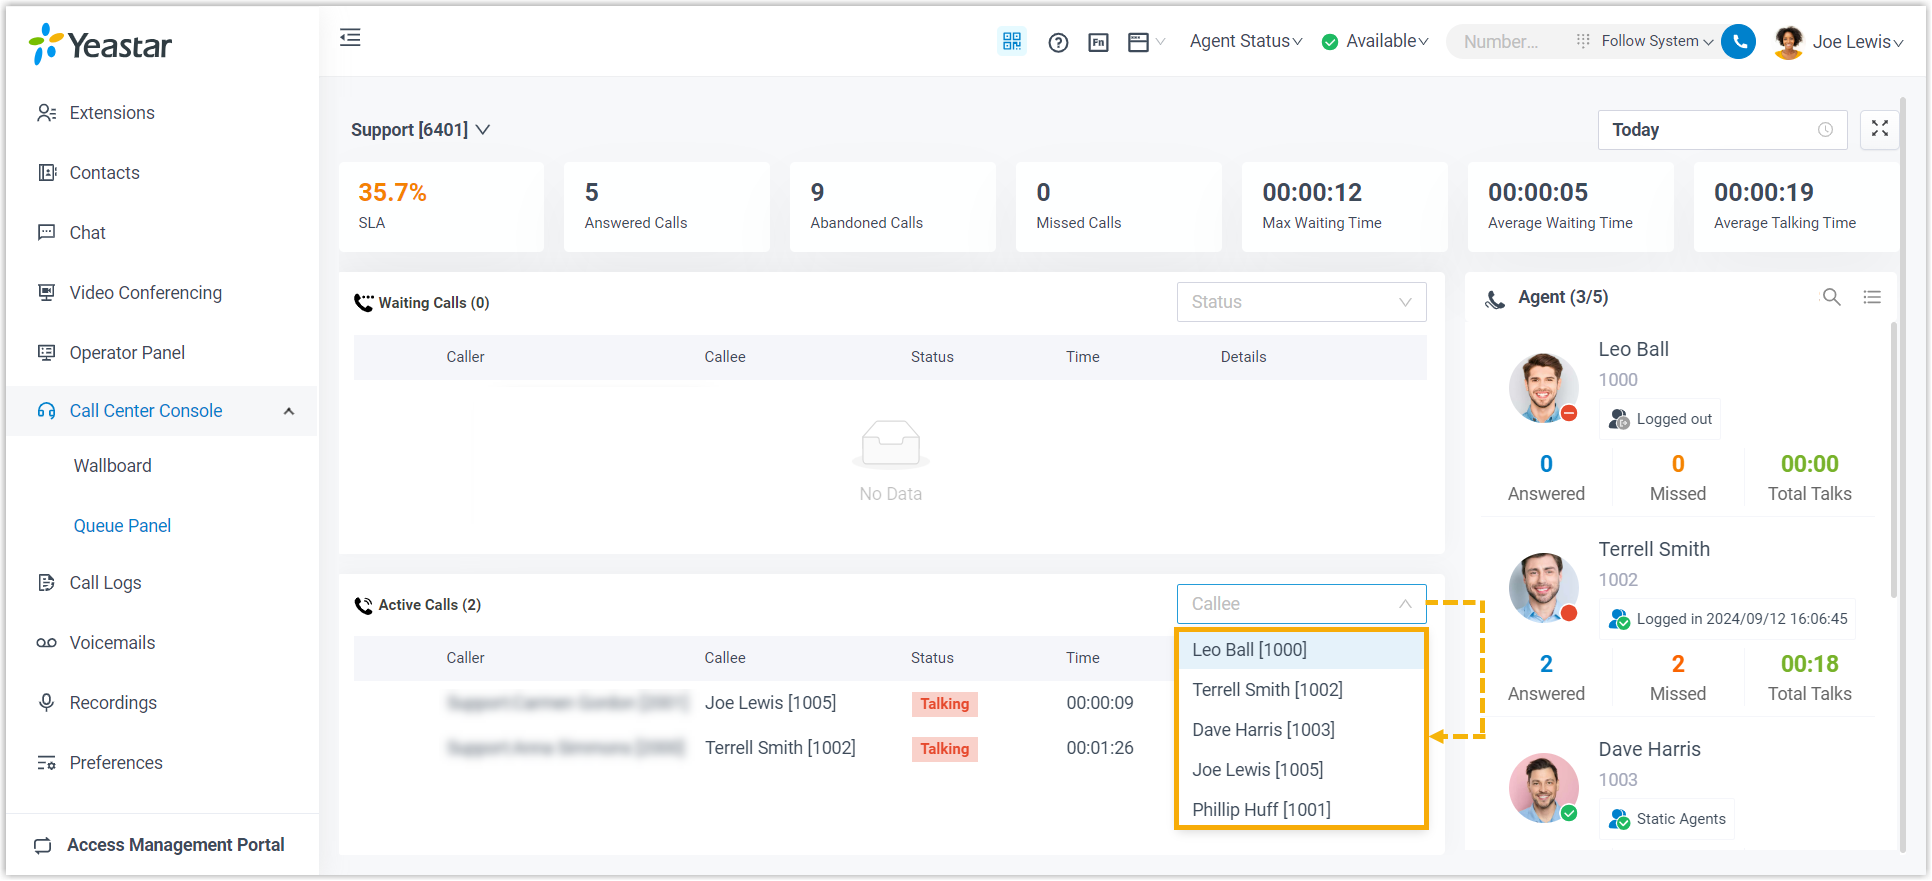
Section titled “Active call panel”This panel lists answered calls that are in progress, in real time, showing the caller, callee, queue, status, time, and details. You can manage these calls as needed.
Agent panel
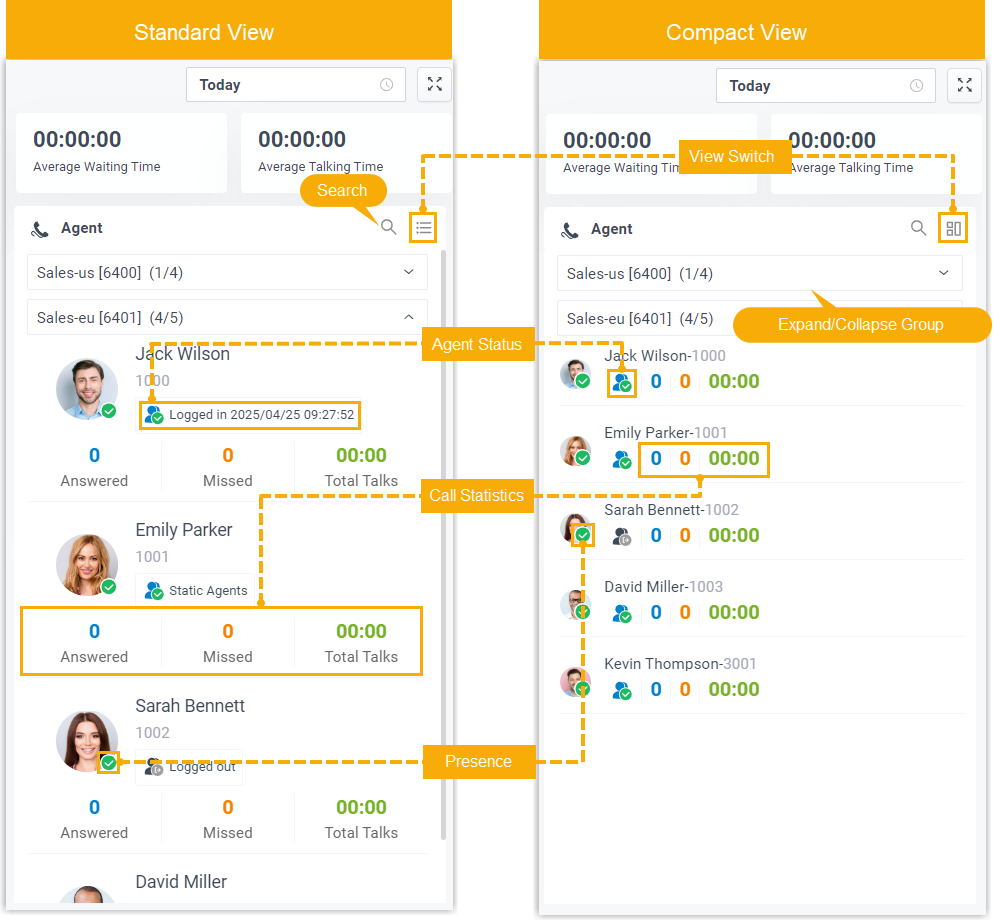
Section titled “Agent panel”The agent panel shows details for each agent in the selected queues, including their presence, queue status, and personal queue call statistics.
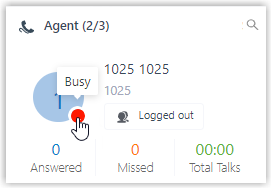
Agent presence
Hover over an agent’s presence icon to see their current status.
Queue status
| Icon | Meaning |
|---|---|
 | The agent is logged in to the queue and available to take calls. |
 | The agent has logged out of the queue. |
 | The agent has paused taking queue calls. |
View switch
The panel opens in Standard View by default. Click View Switch to change to Compact View, which fits more agents on screen so you can review and manage them faster.
Search and filter
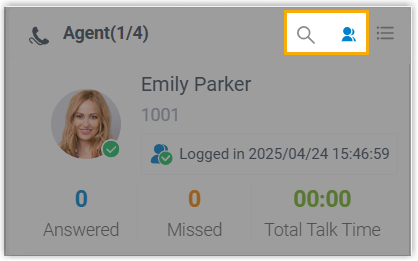
Use these controls to find agents quickly.
| Option | Description |
|---|---|
 | Search for a specific agent. |
 | Show only online agents that meet both of these conditions: the extension is online (signed in to a Cloud Voice App or registered on an endpoint), and the agent status is Log In, Unpause, or Pause. |
Question about this page?
Ask the AI assistant. It starts from this page, then searches the rest of the docs.
Ask Cloud Voice AI
Answers are AI-generated from the docs and may contain mistakes. Verify with the linked pages.