
Satisfaction Survey Report
When a satisfaction survey is turned on for a queue, callers are asked to rate their experience by pressing a key on their phone keypad (a DTMF, or Dual-Tone Multi-Frequency, digit) at the end of the call. The Satisfaction Survey report gathers those keypresses into a single view so you can gauge how a queue and its individual agents are performing. This page walks through opening the report and breaks down each metric it contains.
Open the Satisfaction Survey report
Section titled “Open the Satisfaction Survey report”-
Sign in to the PBX (Private Branch Exchange) web portal and go to Reports and Recordings > Call Reports.
-
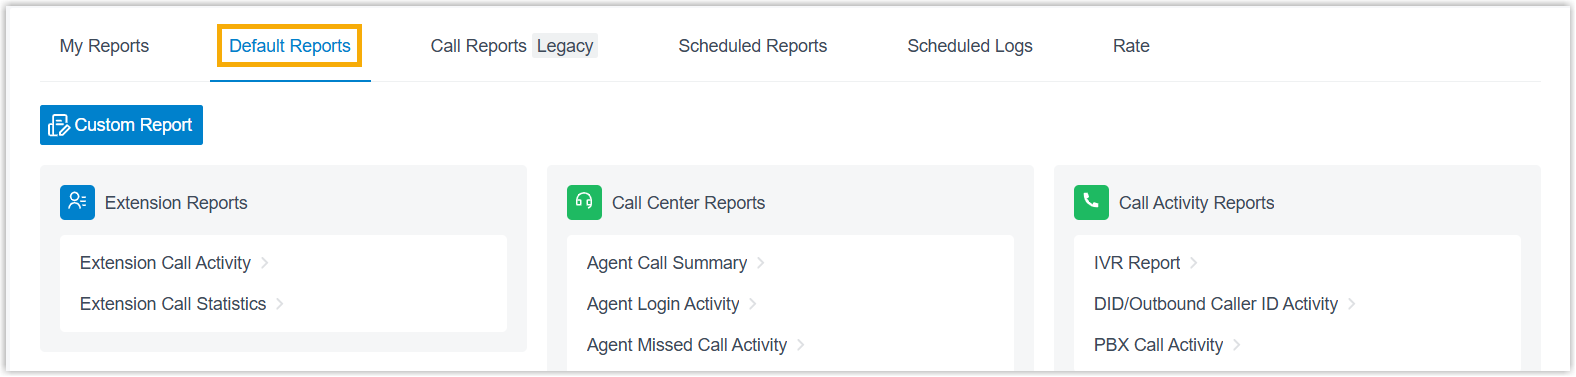
Select the Default Reports tab.
-
In the Call Center Reports pane, click Satisfaction Survey.

-
Choose the data you want to see: a. Use the Time field to set the date range the report should cover. b. Use the Queue drop-down list to pick a queue.
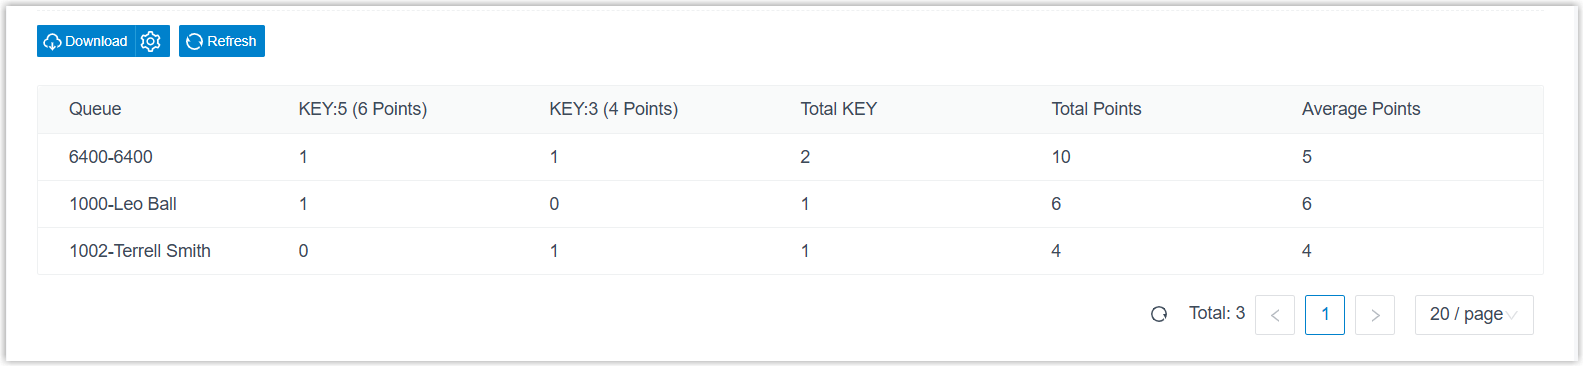
The report matching your selections appears on the page.
Save or export the report
Section titled “Save or export the report”Once the report is on screen, you can keep it for later or send it out automatically.
| Action | What it does |
|---|---|
| Add to Scheduled Reports | Sets up a recurring task that emails the report on a schedule. Click Add to Scheduled Reports at the bottom of the page, then fill in the scheduling details. |
| Download the report | Saves a copy to your computer for offline review or deeper analysis. |
To adjust how a downloaded file is produced, click the settings icon  before downloading, change any of the options below, and save:
- File Format: the format of the downloaded file, CSV, XLS, PDF, or HTML.
- Duration Format: how every duration field is shown, Display in Second (s) or Display as HH:MM:SS.
- Export Fields: which columns to include, All or only the ones you choose (Selected).
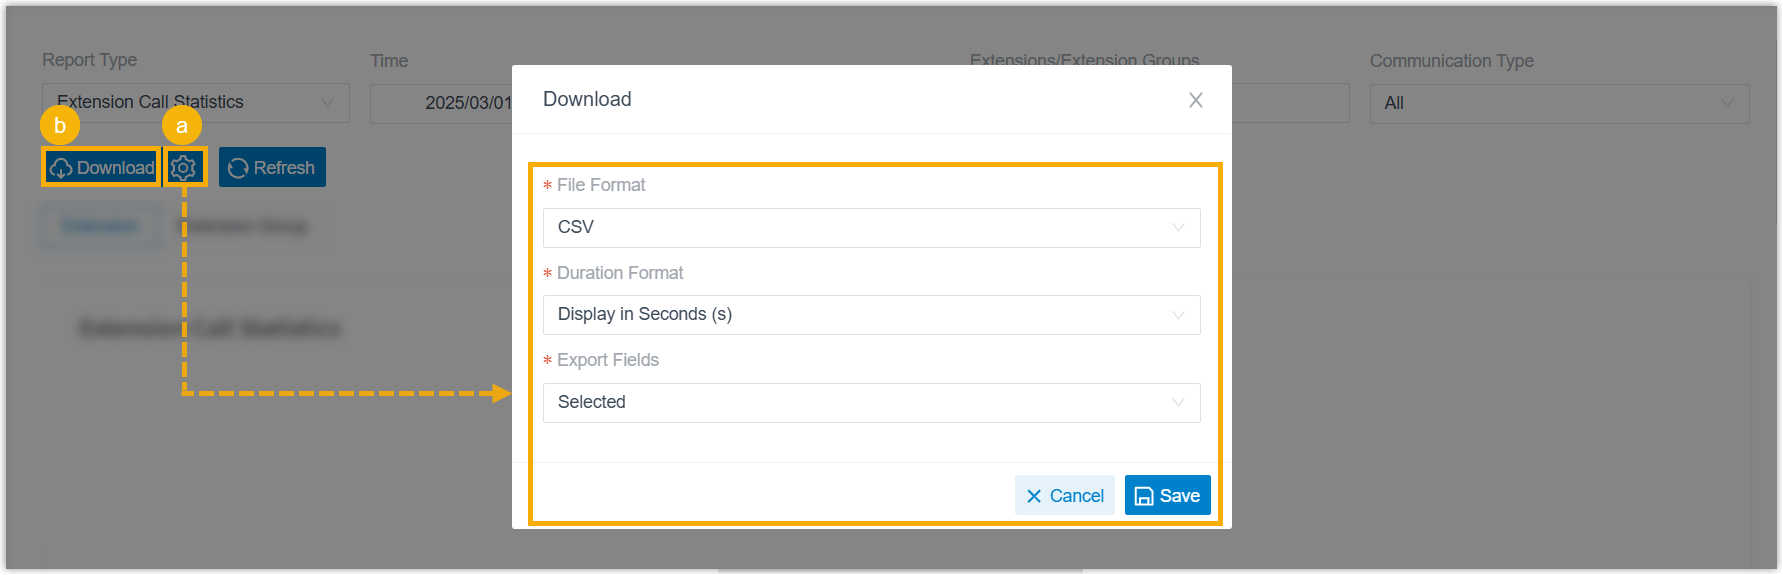
Click Download to save the file.
Report metrics
Section titled “Report metrics”The report summarizes survey results for the queue as a whole and for each agent. The point value shown for a key is the score you assigned to that key when you set up the survey on the queue. The table below explains what each column represents.
| Metric | Description |
|---|---|
| KEY: {key_pressed} ({numeric} Points) | A key a caller could press during the survey, along with the score assigned to that key. |
| Total KEY | The number of keypresses recorded for the queue or agent. |
| Total Points | The sum of all survey scores for the queue or agent. |
| Average Points | The mean survey score for the queue or agent, calculated as Total Points / Total KEY. The result is truncated to two decimal places rather than rounded, so it can read slightly lower than a rounded figure would. |
Question about this page?
Ask the AI assistant. It starts from this page, then searches the rest of the docs.
Ask Cloud Voice AI
Answers are AI-generated from the docs and may contain mistakes. Verify with the linked pages.