
Import PBX Data from a Database into Grafana
Once your PBX (Private Branch Exchange, your phone system) data is flowing into a third-party database, you can surface it in Grafana. Register the database as a Grafana data source, then load the Cloud Voice dashboard template to turn your call records into charts and tables.
Requirements
Section titled “Requirements”| Platform | Requirement |
|---|---|
| Grafana | An account with the Organization administrator role. |
| Third-party database | See the list below. |
For the database, make sure all of the following are in place:
- Version: The database version is one that Grafana supports. For details, see Grafana’s reference pages for Microsoft SQL Server, MySQL-compatible databases, and PostgreSQL-compatible databases.
- Network: Grafana can reach the database over the network.
- Account: A login with read-only (SELECT) access to the schemas and tables you plan to query.
Prerequisites
Section titled “Prerequisites”You have already synced your PBX data to a third-party database.
Overview
Section titled “Overview”Setting up the integration takes two stages:
- Connect Grafana to the database.
- Import a dashboard from the database using the Cloud Voice template.
Step 1. Connect Grafana to the database
Section titled “Step 1. Connect Grafana to the database”-
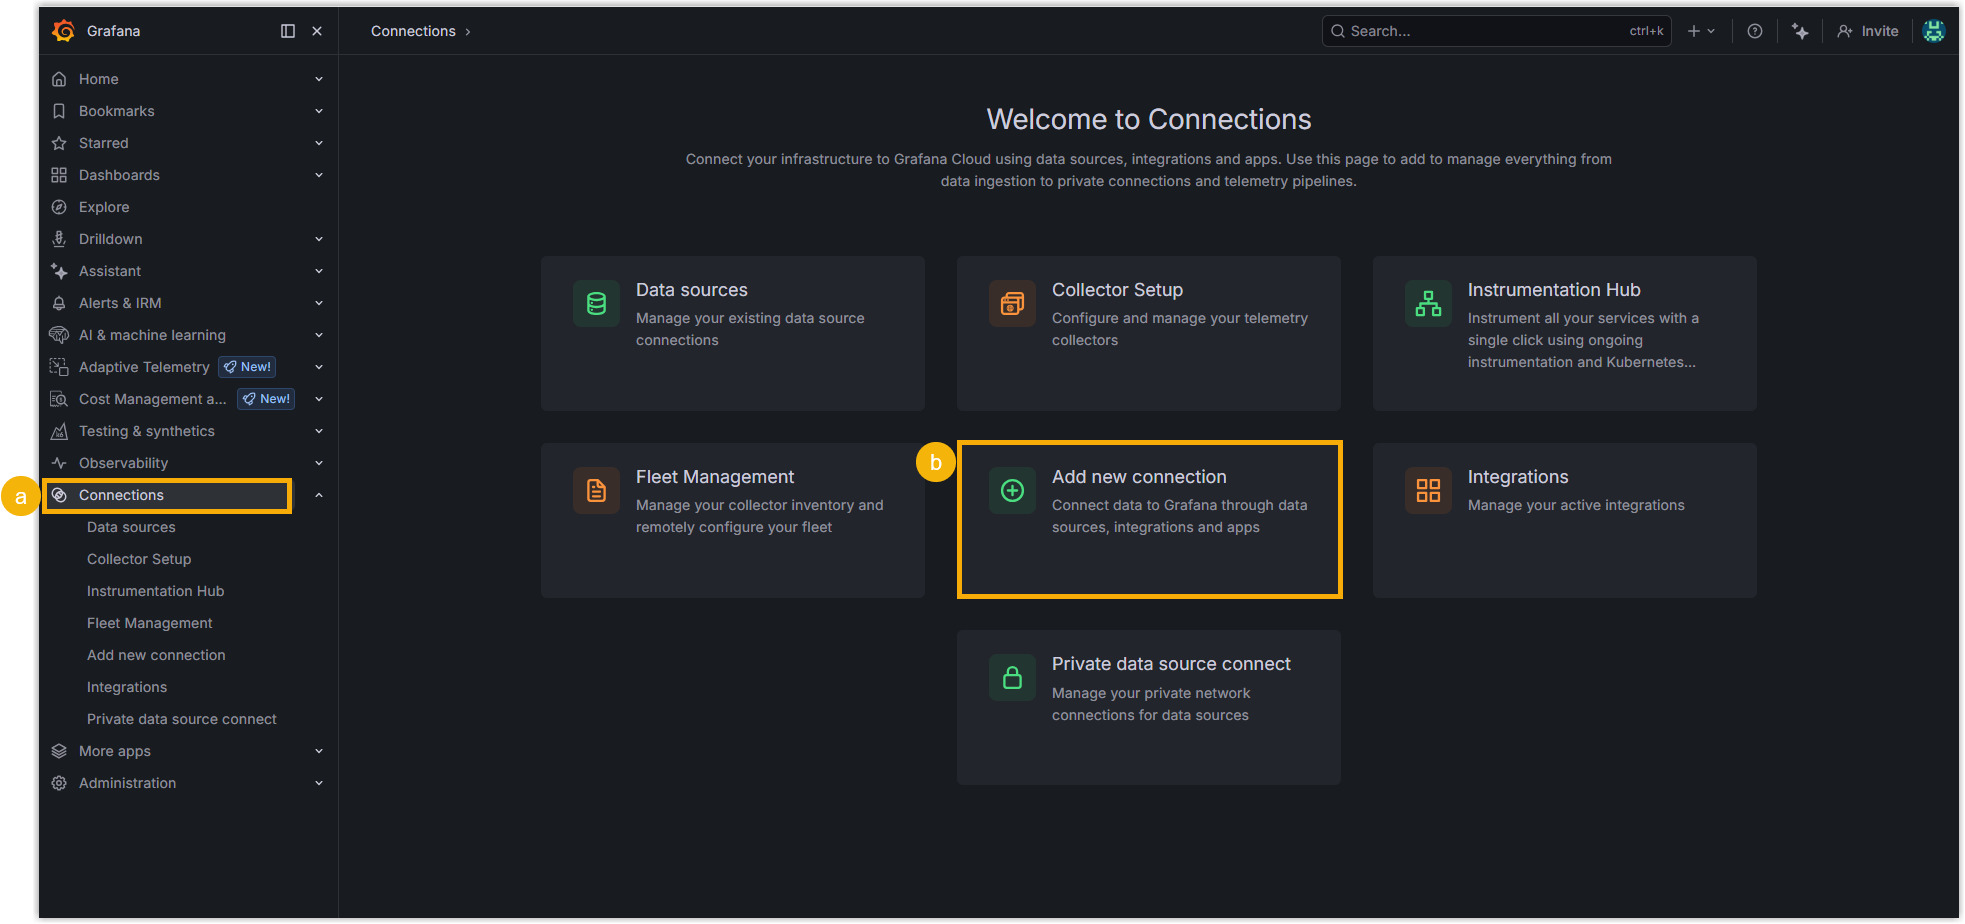
Sign in to Grafana and go to Connections > Add new connection.
-
Add a data source:
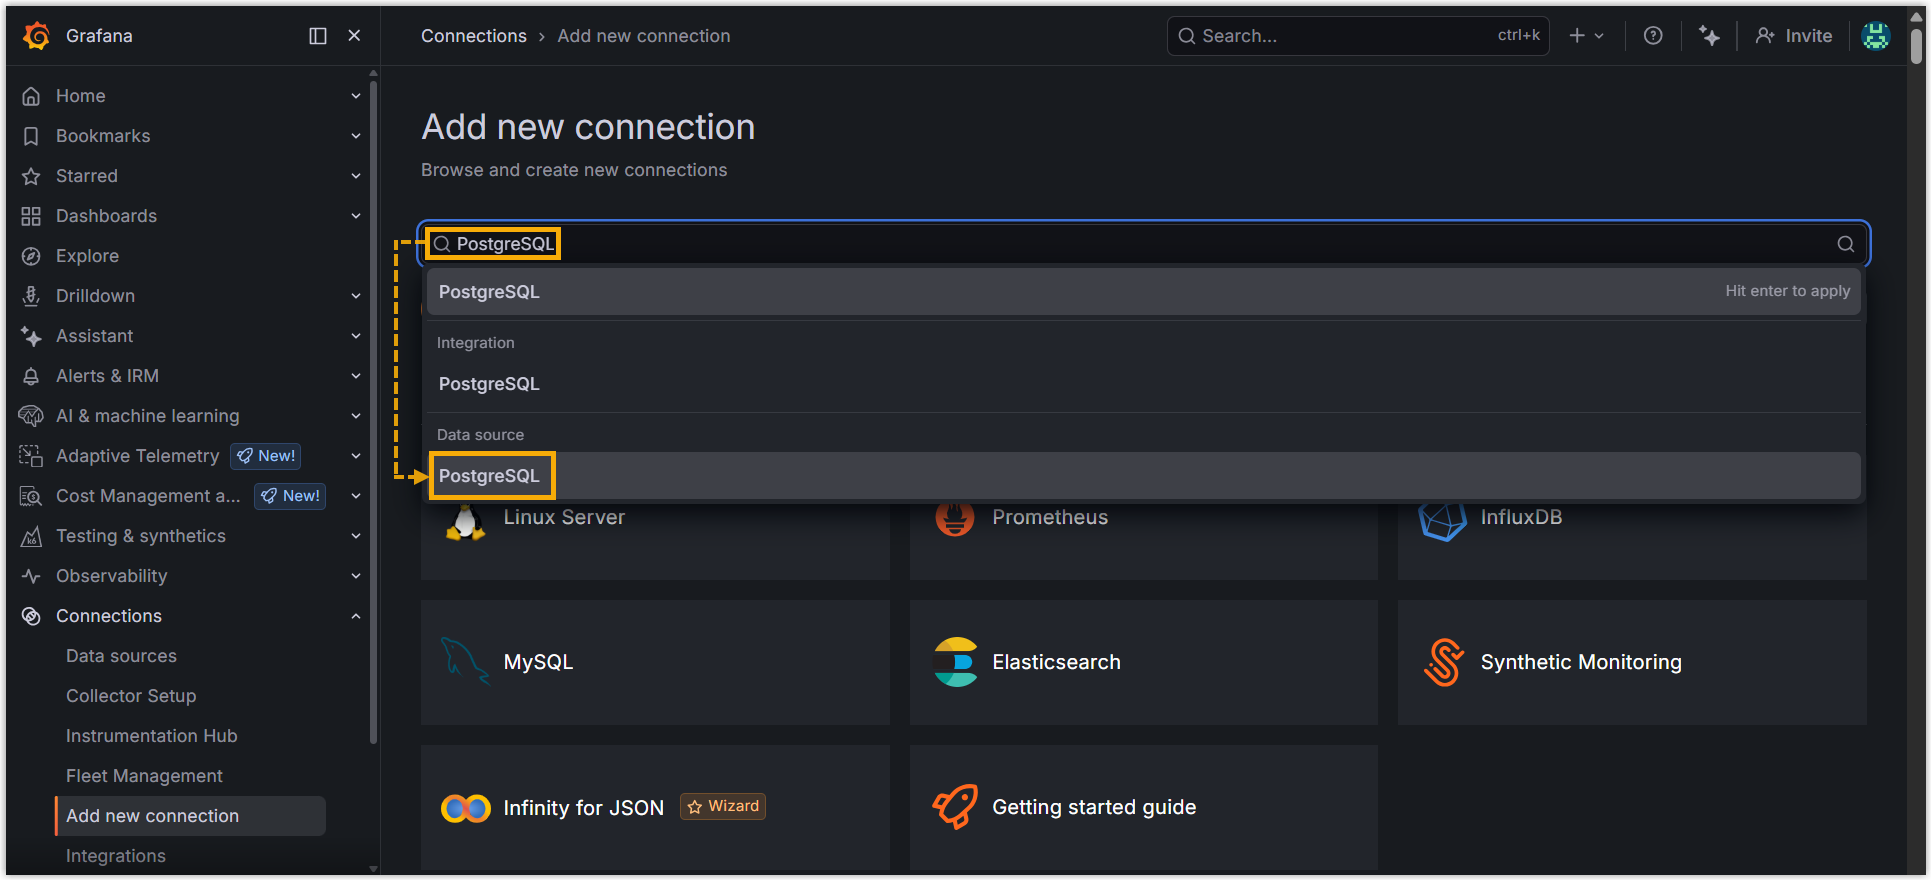
a. Search for your database type and pick it from the list of available data sources. In this example, choose the PostgreSQL data source.
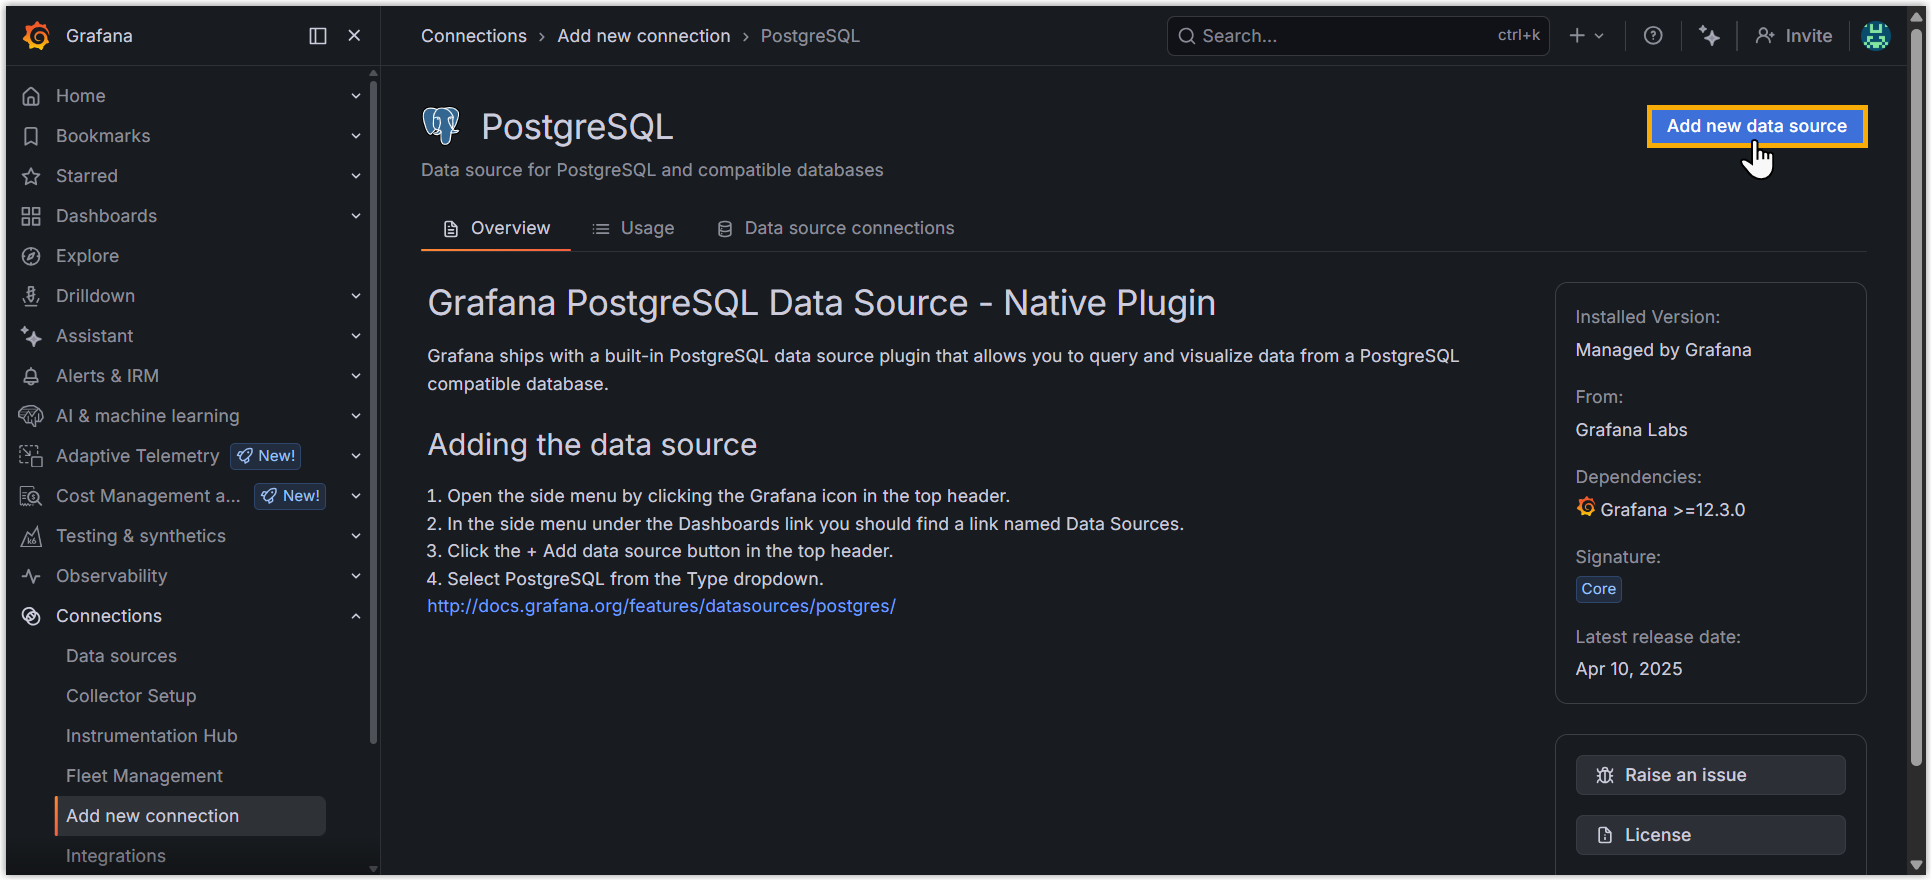
b. In the top-right corner, click Add new data source.
-
Enter the details Grafana needs to reach the database:
a. Under Connection, provide the connection settings.
Item Description Host URL The IP address or domain name of the machine running the database, along with the database port. Database name The name of the database. b. Under Authentication, provide the sign-in credentials.
Item Description Username The username used to connect to the database. Password The password used to connect to the database. -
Optional: Adjust any other settings your setup requires.
-
Scroll to the bottom of the page and click Save & test to validate and store the connection. A Database Connection OK message confirms that Grafana reached the database.
Step 2. Import a dashboard using the template
Section titled “Step 2. Import a dashboard using the template”-
In your browser’s address bar, copy the data source UID (Unique Identifier, the ID Grafana assigns to the data source you just created), it is the final segment of the URL. You need it when editing the template.
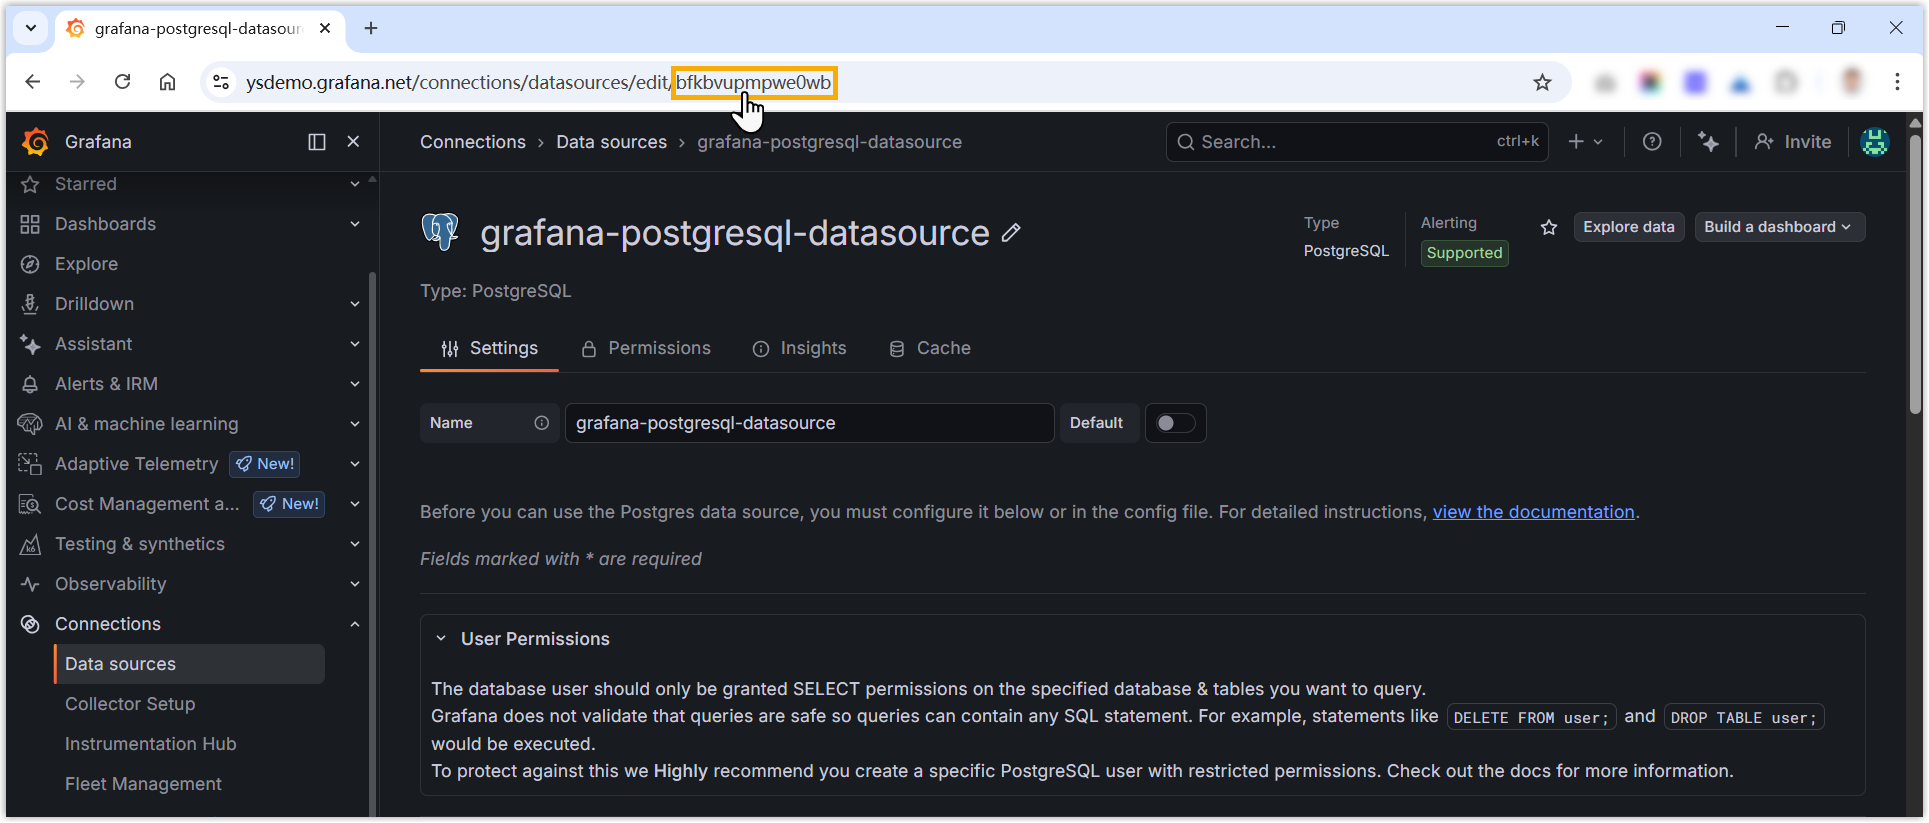
In this example, the UID is
bfkbvupmpwe0wb. -
Download and edit the dashboard JSON template:
a. Download and unzip the Cloud Voice dashboard template package. It bundles templates for each supported database, pick the one that matches yours. This example uses the PostgreSQL template.

b. In every panel, replace each
uidvalue underdatasourcewith the UID you copied.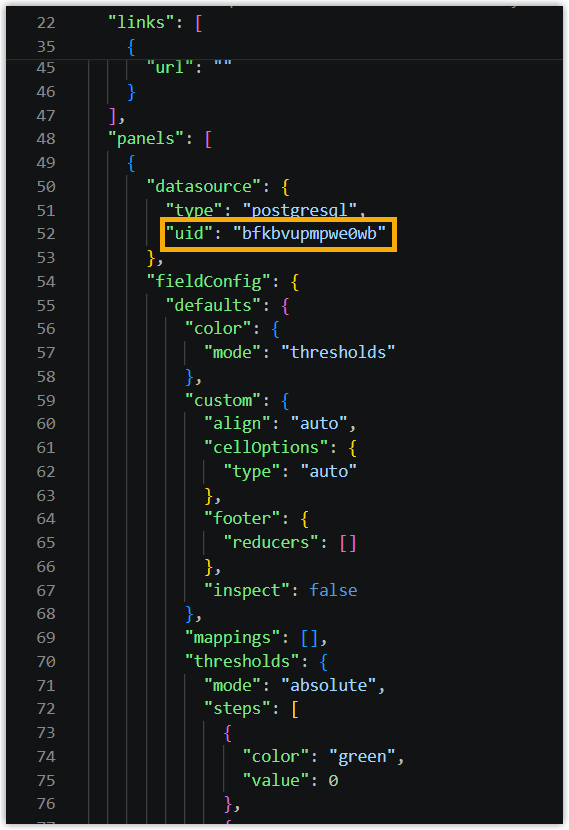
c. Optional: Change the
titlevalue. Grafana uses it as the dashboard name.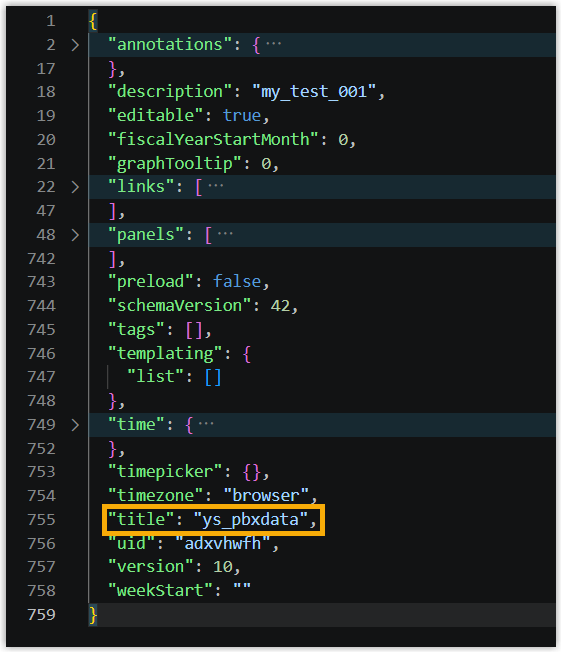
-
Import the edited template into Grafana:
a. In the left navigation bar, click Dashboards.
b. In the top-right corner, click the add icon
 and choose Import dashboard.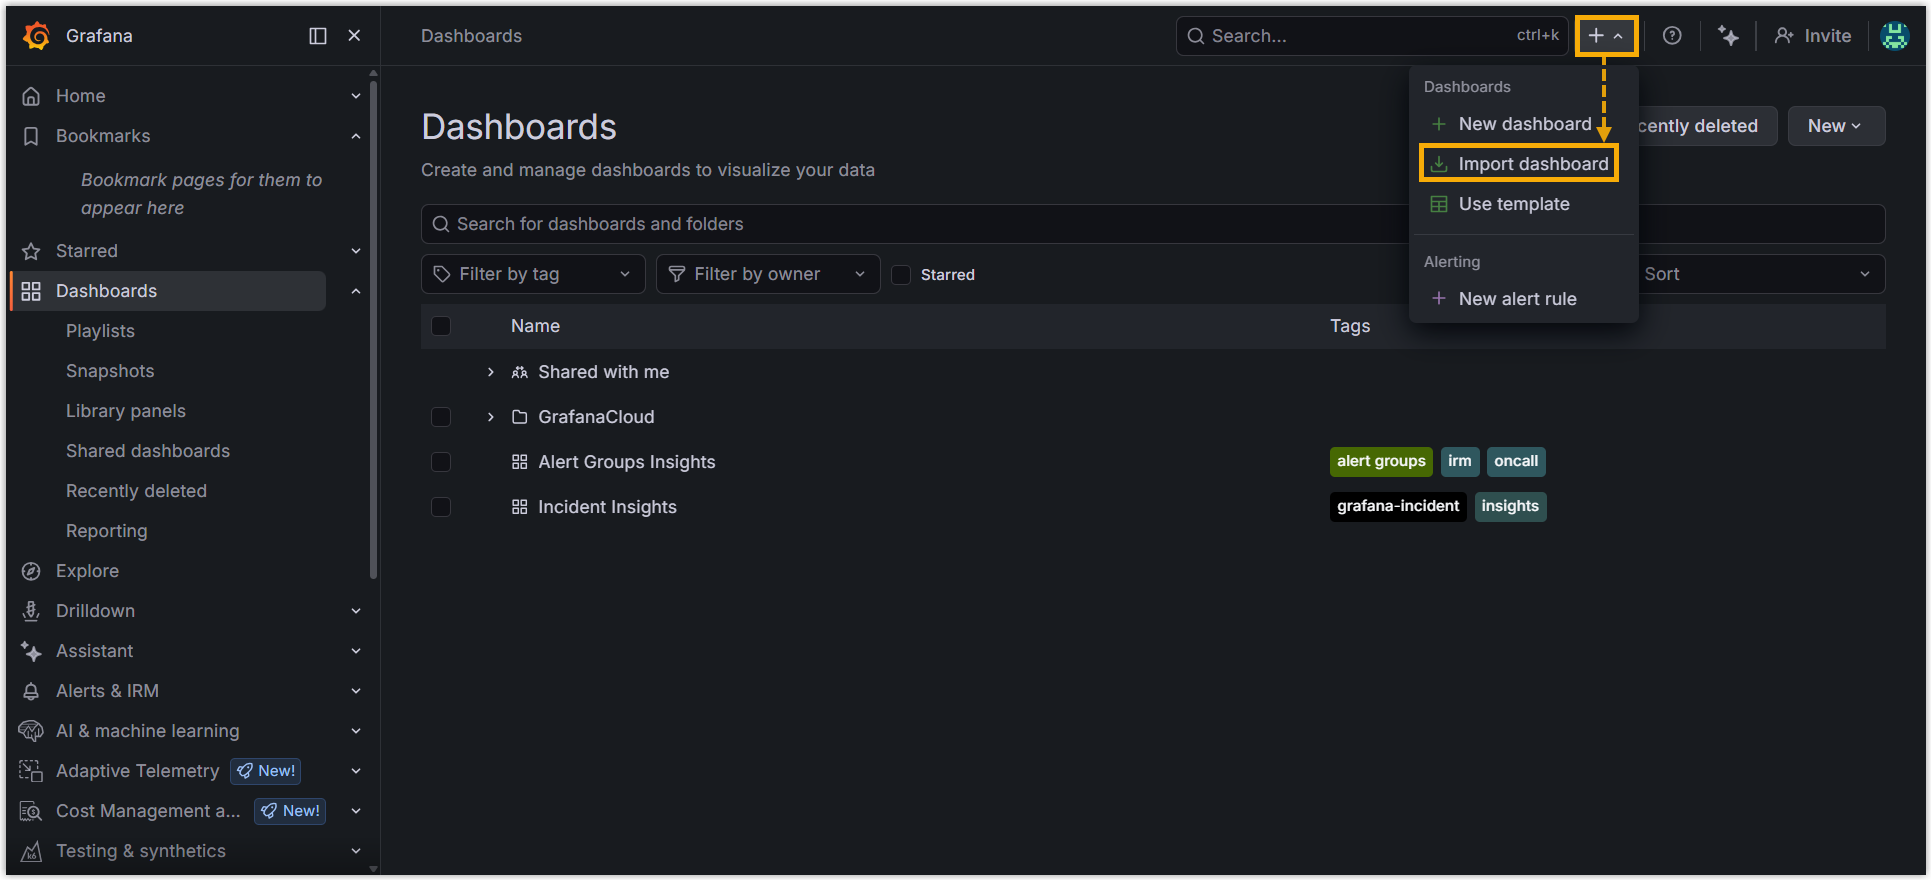
c. Click Upload dashboard JSON file and select your edited
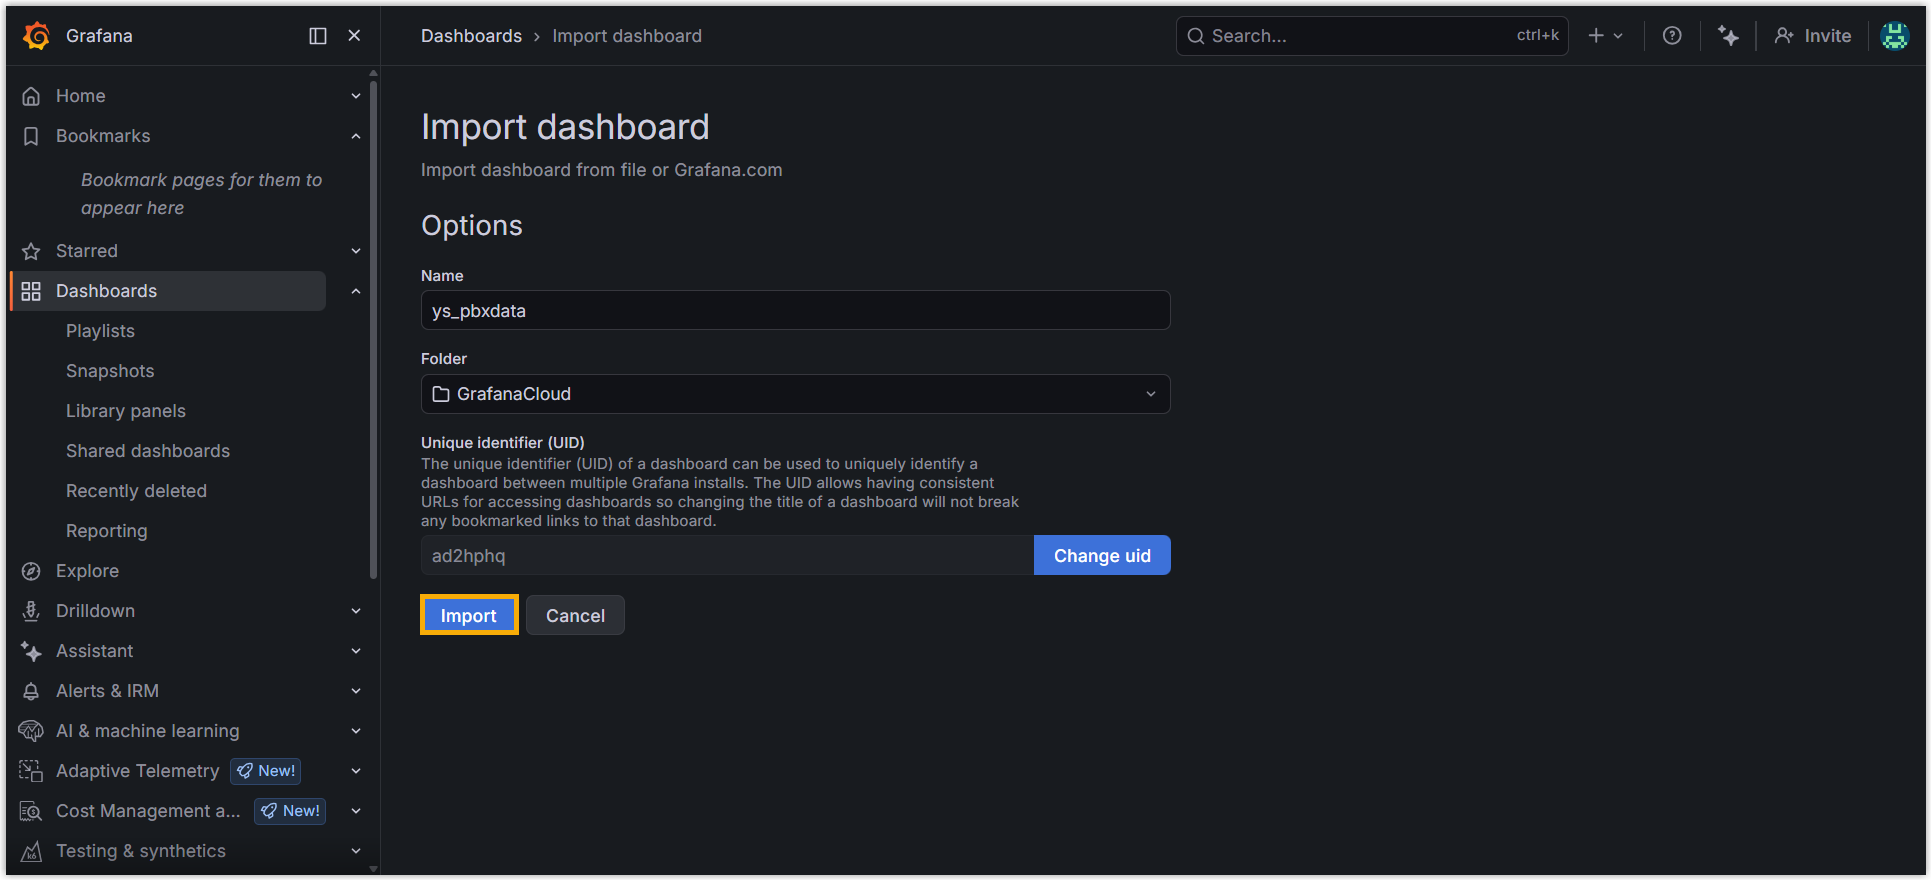
.jsonfile.d. Click Import.
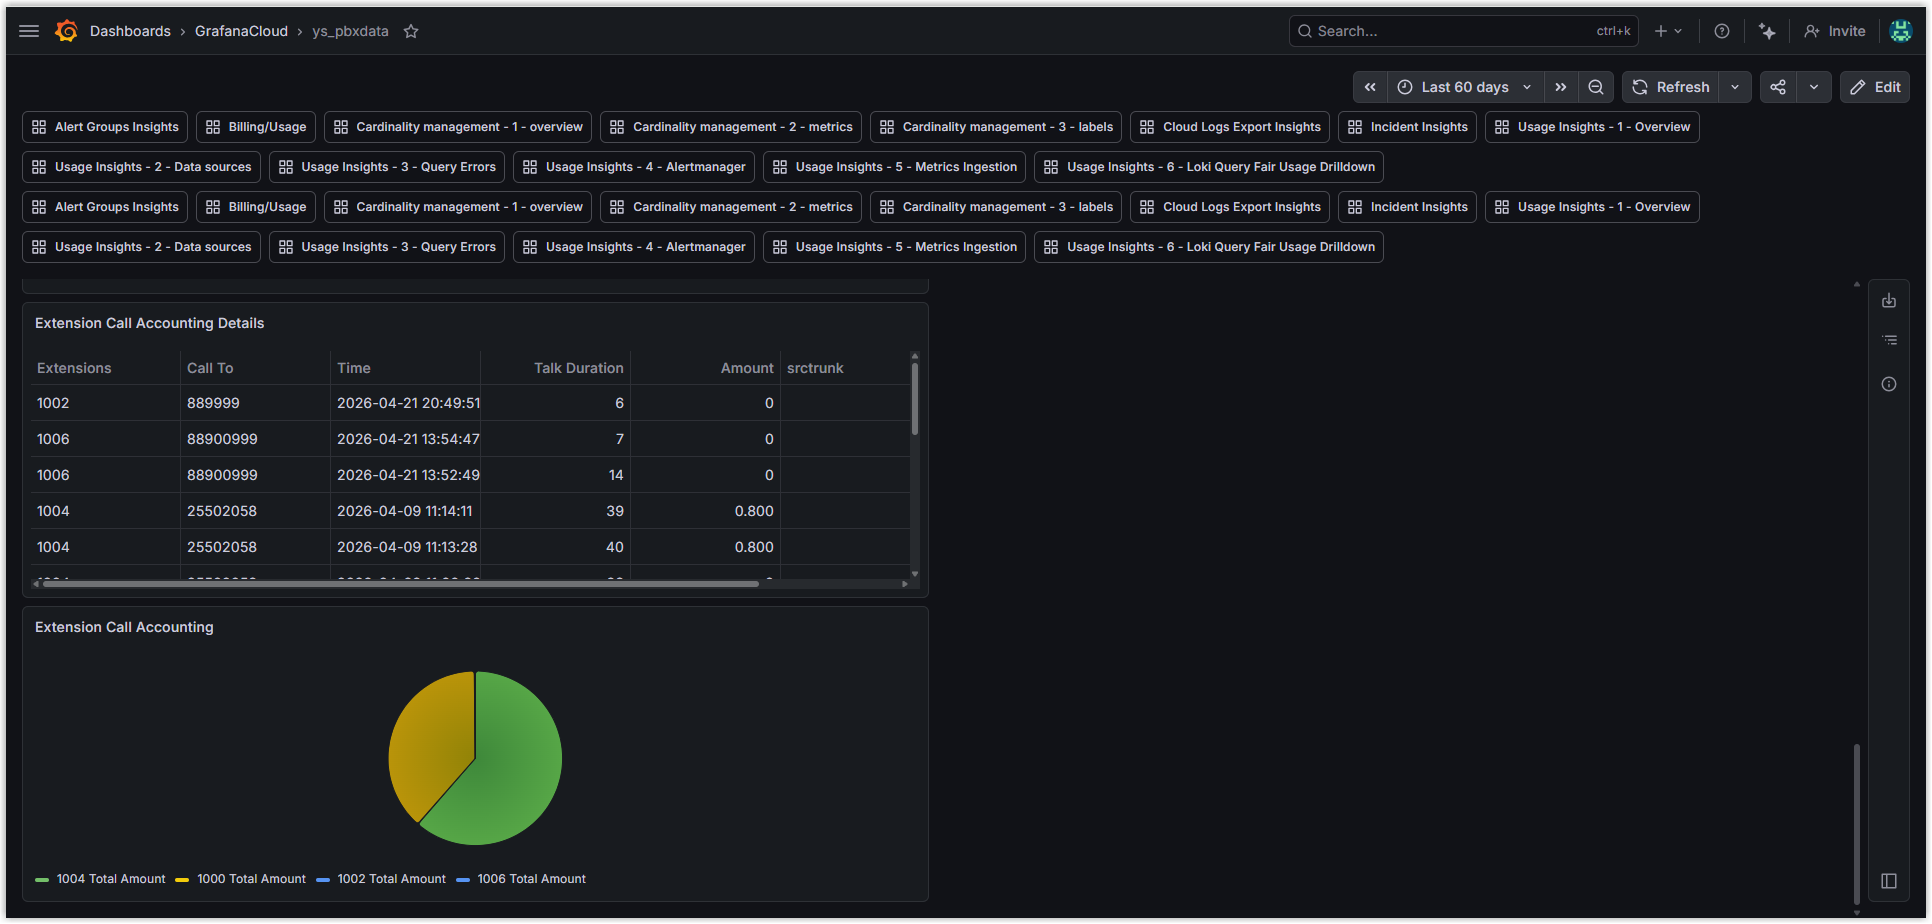
Result
Section titled “Result”The dashboard loads into Grafana and your PBX data appears as charts and tables.
What to do next
Section titled “What to do next”Tune the SQL queries in the dashboard to control exactly which data appears.
Question about this page?
Ask the AI assistant. It starts from this page, then searches the rest of the docs.
Ask Cloud Voice AI
Answers are AI-generated from the docs and may contain mistakes. Verify with the linked pages.