
Inbound Queue Activity Analysis Report
The Inbound Queue Activity Analysis report gives you a close-up view of how your queues handle inbound calls, with results grouped by time period and by how long callers waited before an agent picked up. Use it to spot busy periods, long waits, and abandoned calls so you can staff and tune your queues. This page shows you how to open the report, shape it with filters, and interpret the metrics it returns.
Open the report
Section titled “Open the report”-
Sign in to the PBX (Private Branch Exchange, your phone system) web portal and go to Reports and Recordings > Call Reports.
-
Open the Inbound Queue Activity Analysis report.
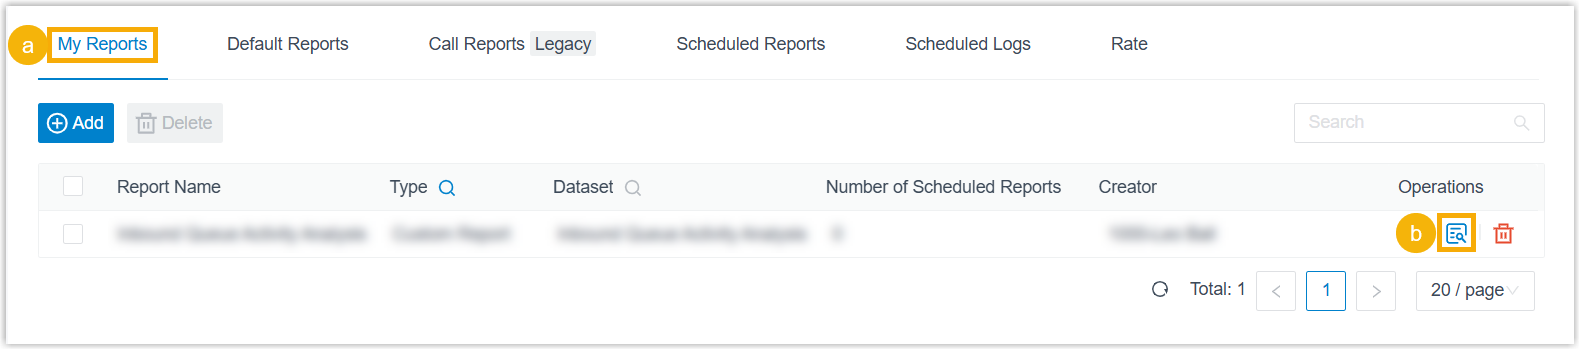
- Select the My Reports tab.
- Select
 next to the report.
-
Set the filters that define what the report covers.

Filter What it does Queue Pick one or more queues to include. Time Range & Select Date Set the date range the report should span. Time Set the time-of-day window the report should span. Wait Time Range Choose the interval used to group how long callers waited in the queue before reaching an agent: Per 30 Seconds, Per 60 Seconds, Per 5 Minutes, or Per 10 Minutes. This only changes how waits are bucketed in the results; it does not remove any calls. Exclude Calls Abandoned within Xs Set a ring duration below which abandoned calls are dropped. Any call abandoned within this window is left out of the report. Exclude Calls within Xs Set a talk duration below which answered calls are dropped. Any call that ends within this window is left out of the report. The results that match your filters appear on the page.

-
Optional: Adjust the columns so the report highlights the indicators you care about most.
Action How Choose which columns show Select  and pick the columns to display.
Reorder columns Select  next to a field and drag it to the position you want.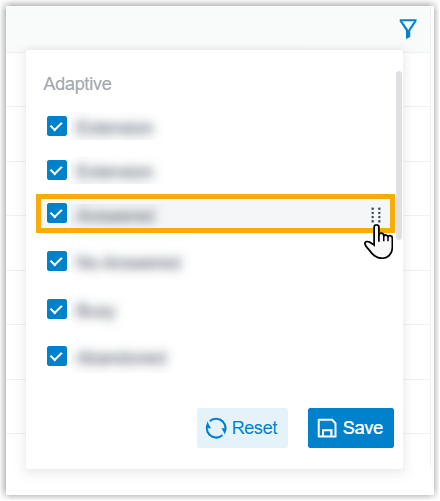
-
Optional: Keep the report handy or have it delivered on a schedule.
Save it to My Reports
- At the bottom of the page, select Add to My Reports.
- Give the report a name you will recognize, and adjust its filters or metrics if you like.
- Select Save.
Send it on a schedule
- At the bottom of the page, select Add to Scheduled Reports.
- Finish the remaining scheduling details so the report is emailed automatically. For the full walkthrough of those settings, see Schedule call reports.
Download it
Export the report to your computer for offline review or deeper analysis.
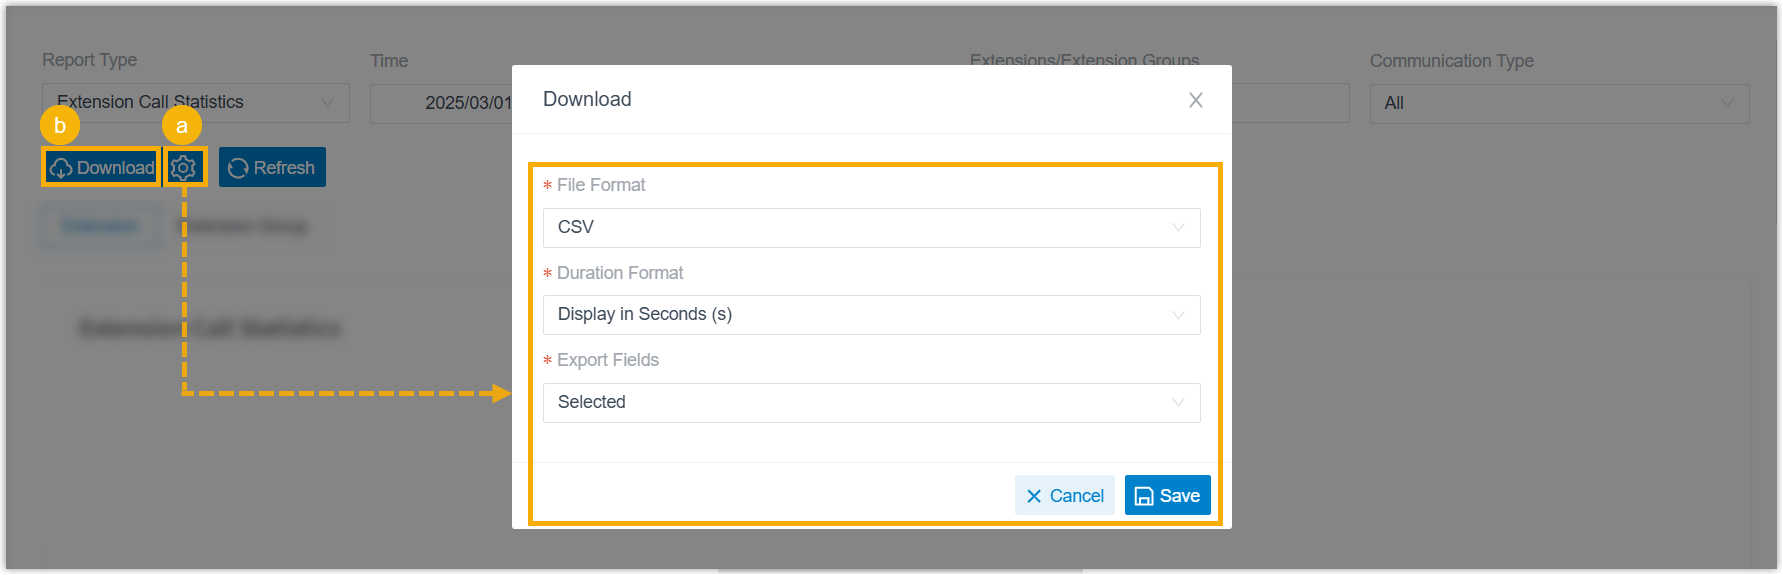
- Optional: Select
 to adjust the download options, then save your changes:
- File Format: the file type of the export: CSV, XLS, PDF, or HTML.
- Duration Format: how every duration field is shown: Display in Second (s) or Display as HH:MM:SS.
- Export Fields: which fields to include: All or Selected.
- Select Download.
Understanding the metrics
Section titled “Understanding the metrics”The report can display a wide set of columns. They are grouped below by what they measure.
Grouping and period
Section titled “Grouping and period”| Metric | Description |
|---|---|
| Queue | The queue’s number and name. |
| Month/Date/Hour | The period in which the queue received the calls. |
| Wait Time Range | The wait-time bucket that groups how long callers waited before connecting to an agent. |
Call counts
Section titled “Call counts”| Metric | Description |
|---|---|
| Total Calls | All calls the queue received. |
| Answered | Queue calls that an agent answered. |
| Abandoned | Queue calls the caller gave up on before being answered. |
| Missed | Queue calls that went unanswered. |
Call rates
Section titled “Call rates”| Metric | Description |
|---|---|
| Answered Rate | Answered calls as a share of all calls received. |
| Abandon Rate | Abandoned calls as a share of all calls received. |
| Missed Rejection Rate | Missed calls as a share of all calls received. |
| SLA | The queue’s Service Level Agreement (SLA): the share of conversations answered within a set target response time. |
Wait time (answered calls)
Section titled “Wait time (answered calls)”Waiting time is measured from when a call enters the queue until it connects to an agent. These columns count only calls that were answered.
| Metric | Description |
|---|---|
| Total Wait Time | Combined wait time across the answered calls. |
| Max Wait Time | The longest single wait among answered calls. |
| AVG Wait Time | The average wait per answered call. |
Wait time (all calls)
Section titled “Wait time (all calls)”The same measure applied to every queue call, answered or not.
| Metric | Description |
|---|---|
| Total Wait Time (All Calls) | Combined wait time across all calls. |
| Max Wait Time (All Calls) | The longest single wait among all calls. |
| AVG Wait Time (All Calls) | The average wait across all calls. |
Talk time
Section titled “Talk time”Talk time covers the time agents spent on queue calls, hold time included.
| Metric | Description |
|---|---|
| Total Talk Time | Combined talk time across the calls. |
| Max Talk Time | The longest single conversation. |
| AVG Talk Time | The average talk time per call. |
Pure talk time
Section titled “Pure talk time”Pure talk time is the same measure with hold time removed.
| Metric | Description |
|---|---|
| Total Pure Talk Time | Combined conversation time, hold time excluded. |
| Max Pure Talk Time | The longest single conversation, hold time excluded. |
| AVG Pure Talk Time | The average conversation time per call, hold time excluded. |
Hold time
Section titled “Hold time”| Metric | Description |
|---|---|
| Total Hold Time | Combined time agents kept queue calls on hold. |
| Max Hold Time | The longest single hold. |
| AVG Hold Time | The average hold time per call. |
Handle time
Section titled “Handle time”Handle time spans the full life of a queue call, from the moment it starts ringing until it ends.
| Metric | Description |
|---|---|
| Total Handle Time | Combined handle time across the calls. |
| Max Handle Time | The longest single call handled. |
| AVG Handle Time | The average handle time per call. |
Question about this page?
Ask the AI assistant. It starts from this page, then searches the rest of the docs.
Ask Cloud Voice AI
Answers are AI-generated from the docs and may contain mistakes. Verify with the linked pages.